
Fig. 5.
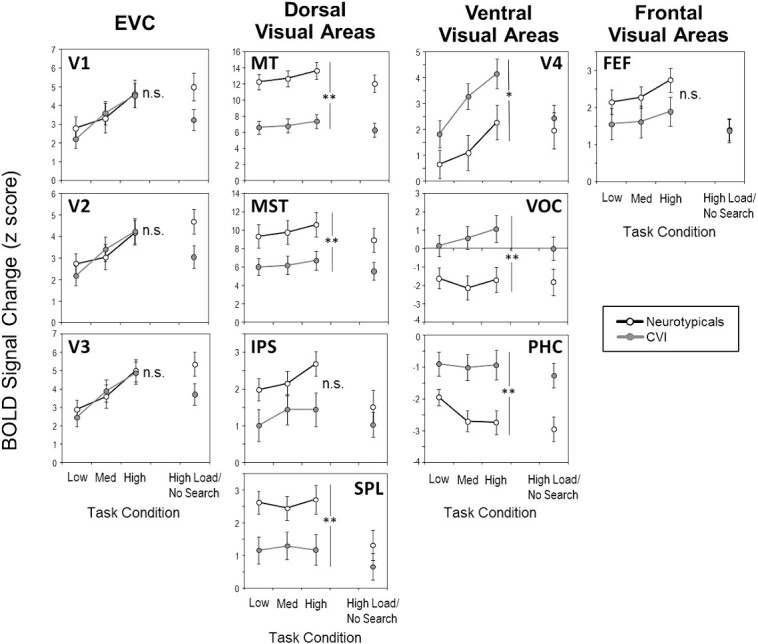
fMRI activity (BOLD signal) for each subregion within the EVC, dorsal stream, ventral stream, and frontal visual ROIs as a function of task difficulty by group. fMRI activity was consistently lower in the CVI group compared to the neurotypical controls in all subregions within the dorsal stream ROI, while the opposite pattern was observed in subregions within ventral stream. Error bars denote standard error of the mean. *** = P < 0.001, ** = P < 0.01, * = P < 0.05, n.s. = nonsignificant. See text for ROI abbreviations.