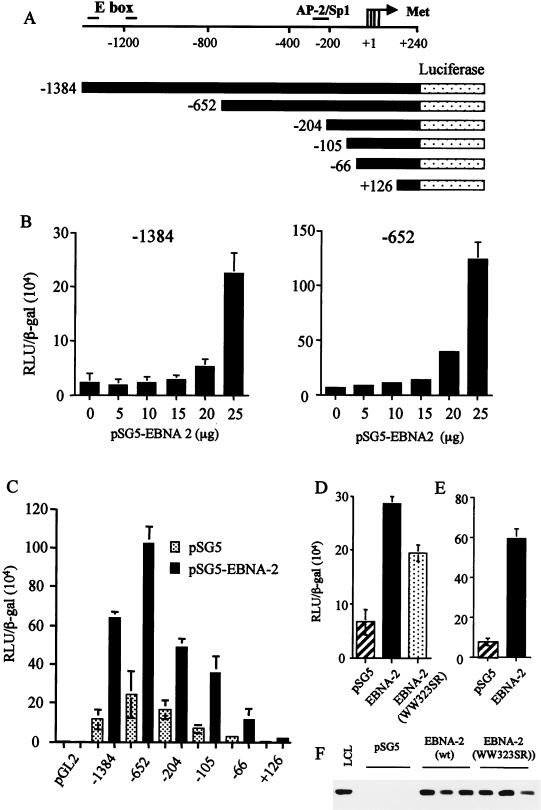
FIG. 5.
(A) Diagram representing regions of the cyclin D2 promoter analyzed for EBNA-2-mediated activation in luciferase reporter assays. Four transcription start sites within the cyclin D2 promoter are indicated by an arrow, and the positions of consensus binding sites for several transcription factors are indicated. E box denotes the c-myc consensus binding sequences, while the AP-2/Sp1 site has been identified previously in DNase 1 footprinting analysis of cycling cells (5). (B) DG75 cells were transiently transfected with −1384 or −652 reporter constructs and various concentrations of an EBNA-2 expression vector. Equivalent amounts of DNA were transfected by adjusting the amount of empty vector pSG5 added. Differences in transfection efficiencies were controlled for by assaying β-galactosidase expressed from cotransfected pCMV-βgal and adjusting relative luciferase units (RLU) accordingly. The values shown are the mean and standard deviation of three transfections. (C) Deletion analysis of the cyclin D2 promoter activated by cotransfection of 20 μg of pSG5-EBNA 2. (D and E) DG75 cells (D) or Jurkat T cells (E) were transiently transfected with −652, pCMV-βgal, and 20 μg of EBNA-2 expression vectors. The activation of −652 induced by wild-type pSG5-EBNA-2 was compared to the activity induced by an equivalent amount of plasmid expressing an RBP-Jκ binding mutant, EBNA-2 WW323SR (D). (F) The expression level of wild-type versus mutant EBNA-2 was compared by Western blot analysis in three separate transfections.

