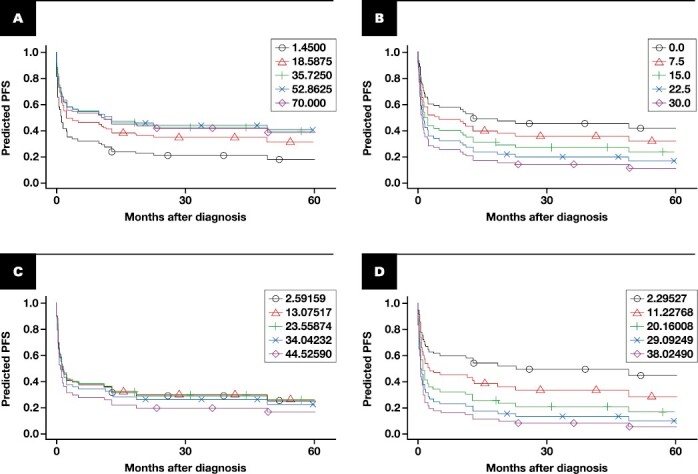
FIGURE 3.

Progression-free survival (PFS) by manual follicular (A) and interfollicular (B) Ki-67 percentage and by digital follicular (C) and interfollicular (D) Ki-67 percentage. These are predicted survival curves from univariable Cox models, one for each of the 4 variables modeled as continuous, linear effects. The values within each plot correspond to the 5th, 25th, 50th, 75th, and 95th percentiles of each variable’s distribution within our cohort.
