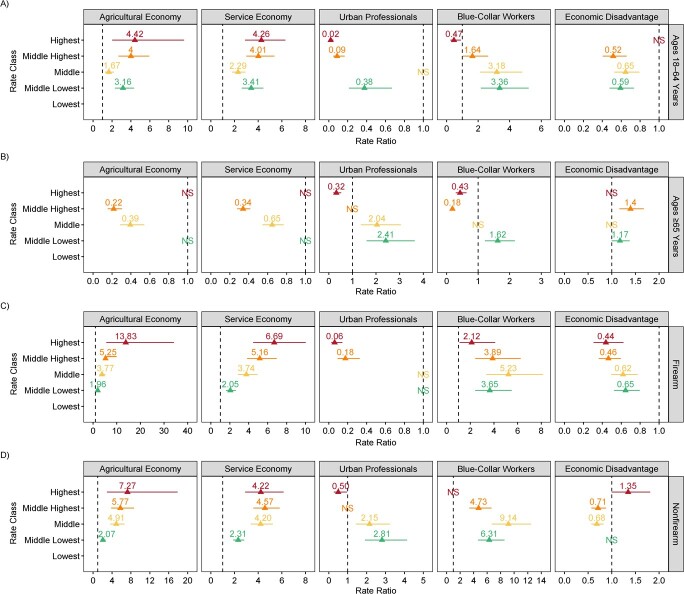
Figure 3.
Rate ratios (triangles) for suicide mortality estimated by a multinomial regression model of 3,140 counties, United States, 2008–2020. A) Ages 18–64 years; B) ages ≥65 years; C) firearm deaths; D) nonfirearm deaths. Clusters are ordered on the y-axis from the lowest suicide risk at the end of the study period to the highest. The lowest suicide rate class (vertical dashed line; rate ratio = 1) was used as the reference group. “NS” (not significant) indicates a non–statistically significant estimate (e.g., the middle cluster for the blue-collar worker variable for the age ≥65 years models). Models controlled for metropolitan status and US Census region. Bars, 95% confidence intervals.

