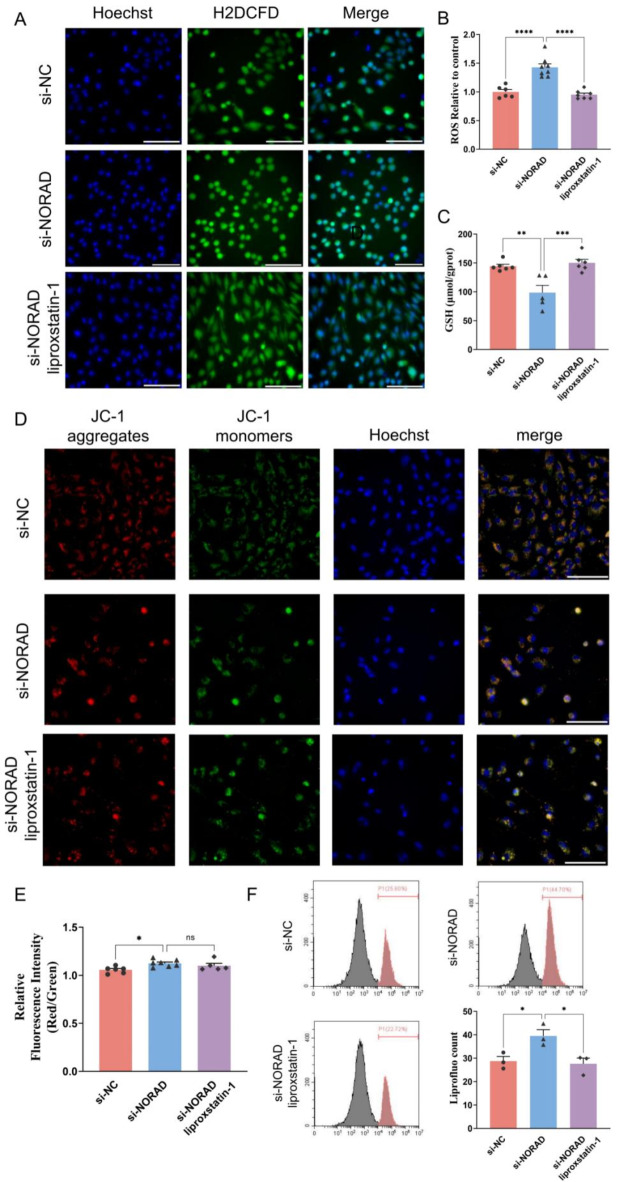
Fig. 8.
Si-NORAD induced HUVEC oxidation. (A) and (B) The images of HUVEC stained with H2DCFD for ROS and Hoechst (blue fluorescent) for nuclei by the high-content live cell imaging system. (C) The GSH level in HUVEC transfected with si-NORAD. (D) HUVEC stained with JC-1 for mitochondria and Hoechst (blue fluorescent) for nuclei. JC-1 forms aggregates (red fluorescent) under high mitochondrial potential condition and becomes monomers (green fluorescent) under low mitochondrial potential condition. Bar = 100 μm. (E) The ratios of red fluorescent intensity to green fluorescent intensity were shown. (F) Representative flow cytometric profiles are shown to demonstrate lipid peroxides with Liperfluo signals. N = 3–8. *P < 0.05, **P < 0.01, ***P < 0.001, ****P < 0.0001, ns, not significant.

