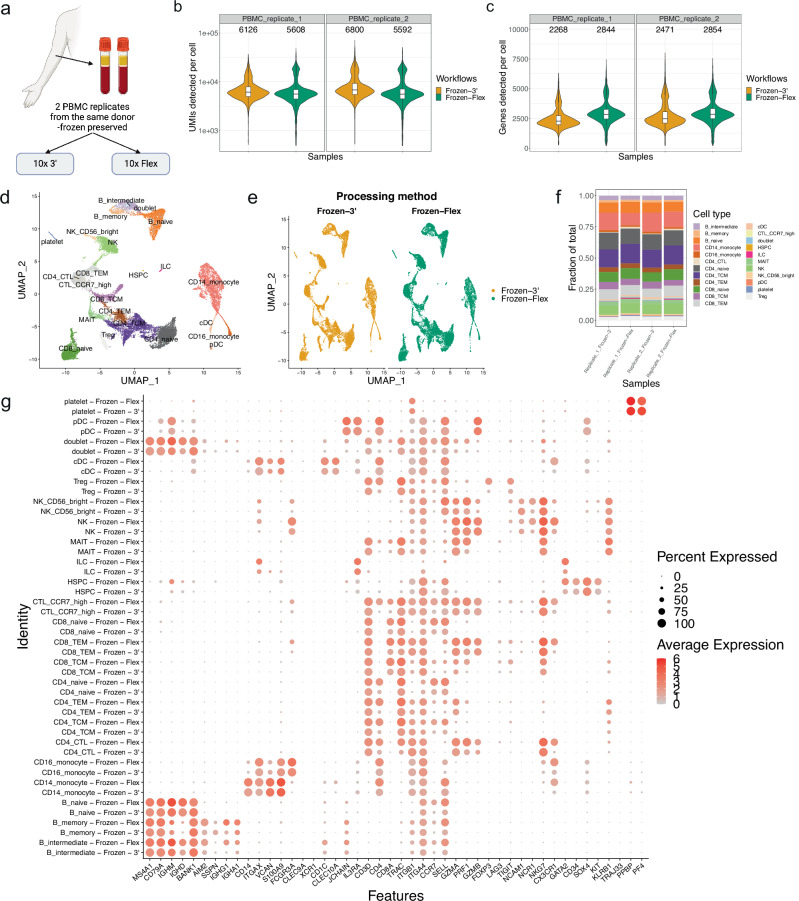
Fig. 1. The 10x single-cell Flex chemistry produces results comparable to those of 10x 3’ chemistry when applied to PBMC samples.
a Illustration of experiment design for 10x 3’ and Flex assay comparison. Created in BioRender. Wang, T. (2024) BioRender.com/l86j691. b, c Violin plots of the number of UMIs (b) and Genes (c) detected per cell. The boxes in the violin plots show the UMIs (b) and Genes (c) median and interquartile range. d UMAP embedding of PBMC cells integrated using the Seurat CCA method and annotated by cell type. e UMAP embedding split by processing method. f Barplots showing the fraction of cell types detected in each technical replicate processed using 10x 3’ or Flex chemistry. g Dotplot of the expression of canonical PBMC cell type markers. N = 2 sample per protocol. The two replicates were conducted using samples from the same donor. Replicates are labeled in (b, c, f).

