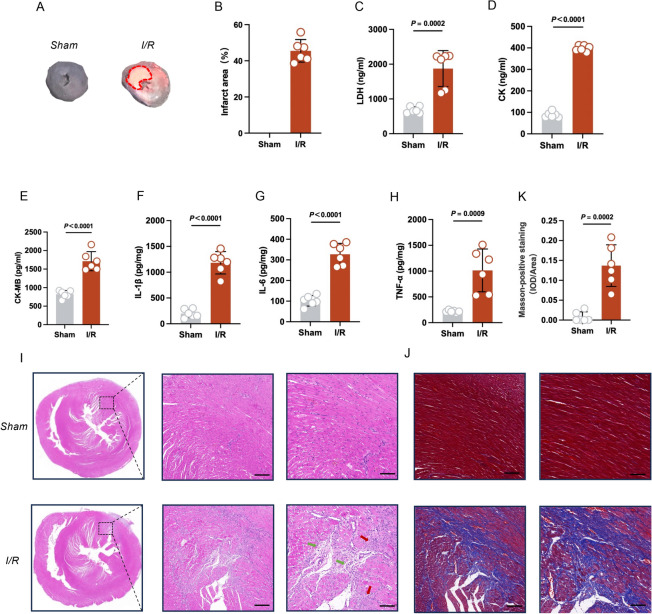
Fig. 2.
Phenotypic analysis of MIRI (n = 6 per group). (A) TTC staining. The red dotted line is the area of infarction. (B) The quantitative results of TTC staining. (C–E) Serum levels of lactate dehydrogenase (LDH), creatine kinase (CK), and CK-MB. (F–H) Tissue levels of IL-1β, IL-6, and TNF-α. (I) H&E staining of myocardial tissue. Green arrows indicate neovascularization, and yellow arrows indicate inflammatory infiltration. Scale bar: 200 μm (left); Scale bar: 100 μm (right). (J) Masson’s trichrome of myocardial tissue. Scale bar: 200 μm (left); Scale bar: 100 μm (right). (K) The quantitative results of Masson staining.

