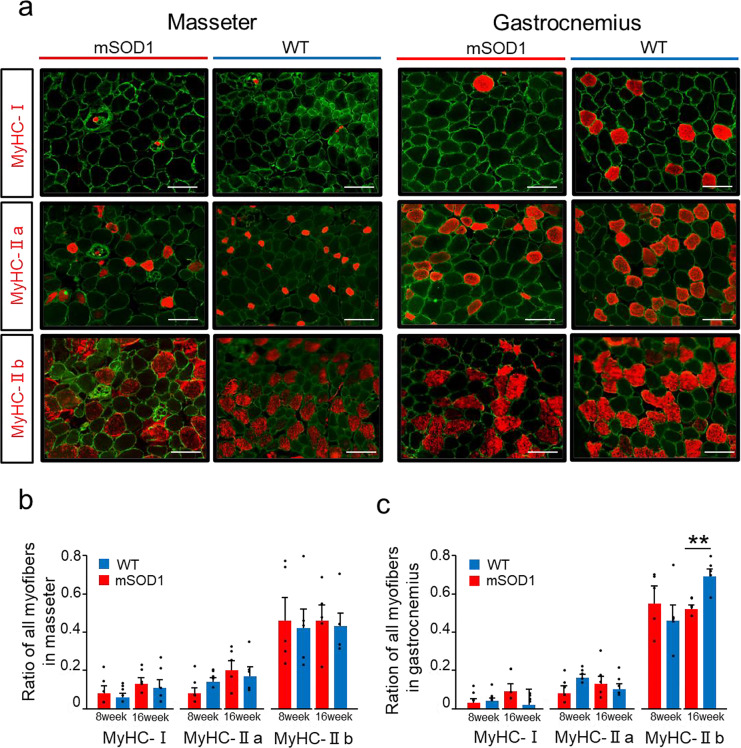
Fig. 5.
Distribution of Muscle Fibre Types (a) Fluorescent immunostaining illustrates Laminin (green) and various MyHC types (red) in the masseter and gastrocnemius muscles in mSOD1 and WT groups at 16 weeks (scale bar: 20 μm). (b) The proportion of each muscle fibre type in the masseter muscle showed no significant differences between mSOD1 and WT groups at 8 and 16 weeks. (c) The proportion of muscle fibre types in the gastrocnemius muscle at 16 weeks, with a notably lower proportion of MyHC-IIb fibres in the mSOD1 group compared with WT [MyHC-IIb, 16 weeks (mSOD1: n = 5, WT: n = 5), as analysed using Student’s t-test, p = 0.003, **p < 0.01].

