
Figure 2: Cancer type classification performance of OncoNPC.
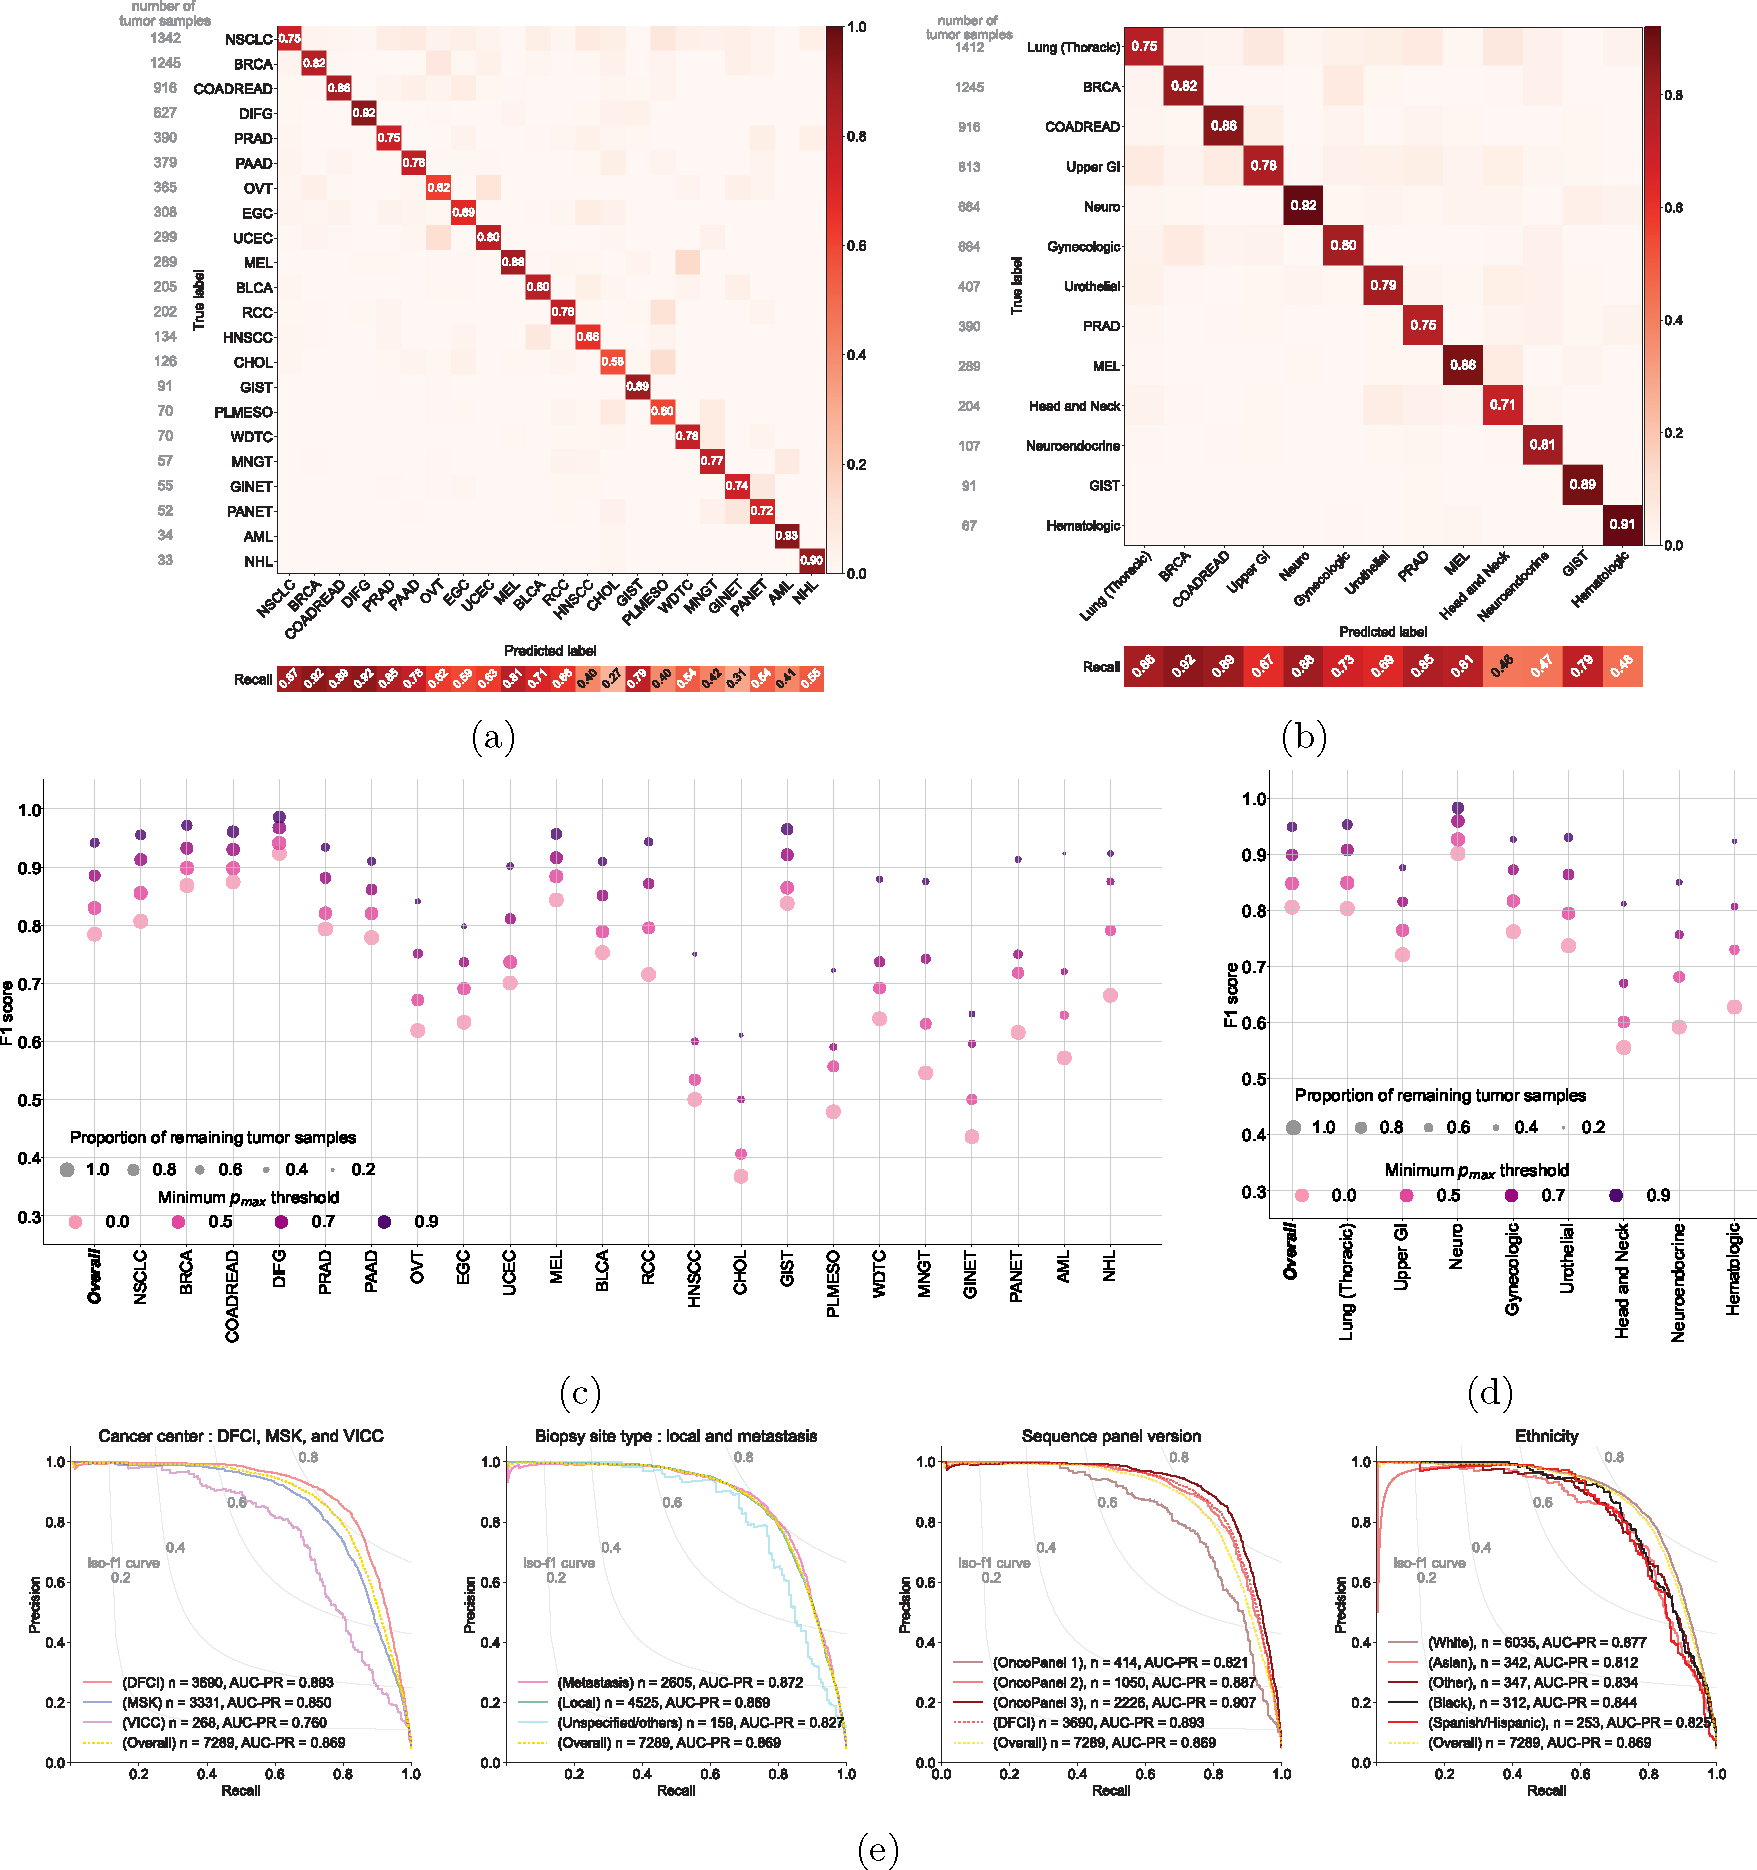
The normalized confusion matrix of OncoNPC classification performance on the held-out test set (n = 7,289) for (a) 22 detailed cancer types and (b) 13 cancer groups (see Table 1). Each confusion matrix displays precision for each cancer type or group on its diagonal. Below the matrix, the recall for each cancer type or group is shown, and the sample size is displayed to the left of the matrix for reference. The performance of OncoNPC in F1 score on the test set across cancer types (c) and groups (d) at 4 different pmax (i.e., prediction confidence) thresholds. Each dot size is scaled by the proportion of tumor samples retained. Note that in (d), we only considered cancer groups that have more than one cancer type. Overall F1 scores were weighted according to the number of confirmed cases across cancer types and cancer groups, respectively. (e) The precision-recall curves showing OncoNPC’s performance on the test set when grouped by cancer center, biopsy site type, sequence panel version, and ethnicity. The yellow dotted curve represents the baseline performance across the entire test set.