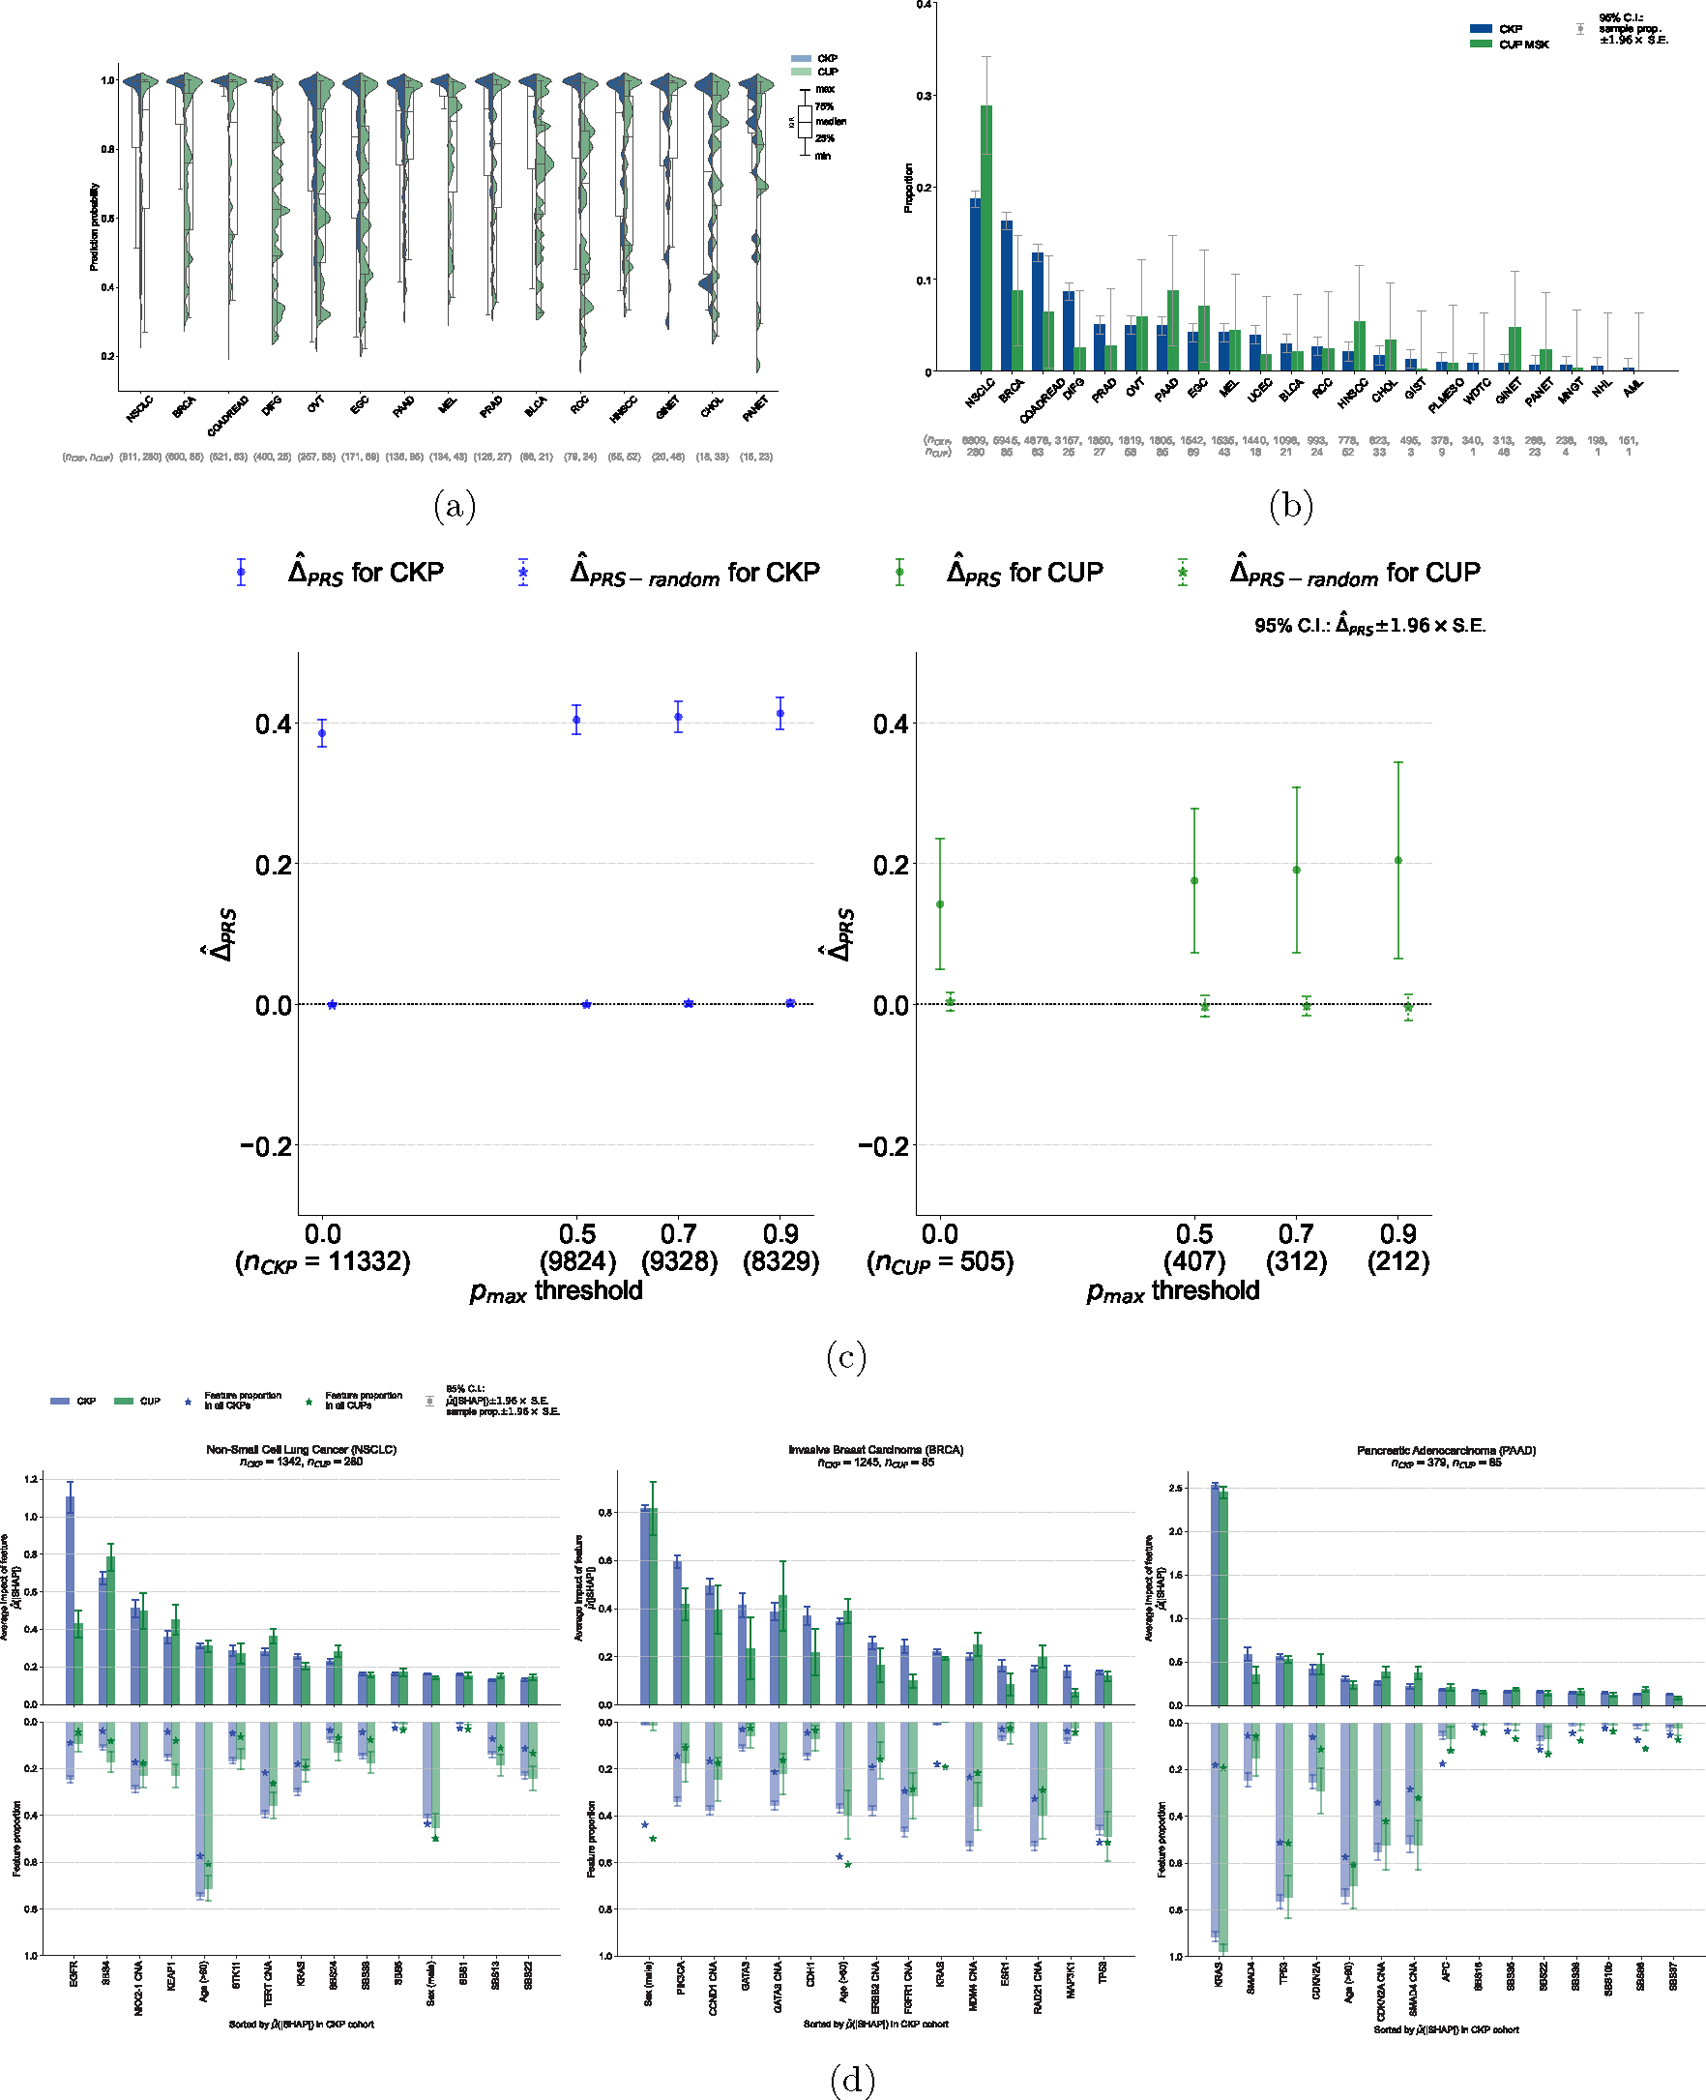
Figure 3: Application of OncoNPC to CUP tumors, germline PRS-based validation, and interpretation of OncoNPC cancer type predictions.

(a) Empirical distributions of prediction probabilities for correctly predicted, held-out CKP tumor samples (n = 3,429) and CUP tumor samples (n = 934) across CKP cancer types (blue) and their corresponding OncoNPC predicted cancer types for CUP tumors (green). Only OncoNPC classifications with at least 20 CUP tumor samples are shown. (b) Proportion of each CKP cancer type and the corresponding OncoNPC predicted CUP cancer type. All training CKP tumor samples (n = 36,445) and all held-out CUP tumor samples (n = 971) are included. For both (a) and (b), the cancer types (x-axis) are ordered by the number of CKP tumor samples in each cancer type. (c) Germline Polygenic Risk Score (PRS) enrichment of the CKP tumor samples (n = 11,332) and CUP tumor samples with available PRS data (n = 505) averaged across 8 cancer types. The magnitude of the enrichment is quantified by : the mean difference between the concordant (i.e., OncoNPC matching) cancer type PRS and mean of PRSs of discordant cancer types (see Methods). is shown for CKPs in blue (for reference) and CUPs in green. As a negative control, is also shown after permuting the OncoNPC labels. (d) Top 15 most important features based on mean absolute SHAP values (i.e., ) for the top 3 most frequently predicted cancer types in the CUP cohort: Non-Small Cell Lung Cancer (NSCLC), Invasive Breast Carcinoma (BRCA), and Pancreatic Adenocarcinoma (PAAD). The feature proportion (i.e., carrier rate) for each feature in corresponding CKP and CUP cancer cohorts as well as the entire CKP and CUP cohorts are shown as bars going downwards and star-shaped markers, respectively. For mutation signature features that have continuous values, individuals with feature values one standard deviation above the mean were treated as positives and the rest as negative. For age, individuals above the population mean were treated as positives and the rest as negatives. 95% confidence intervals were determined using the standard error of the sample mean for and the standard error of the sample proportion for the carrier rate. These intervals are centered at the respective sample values.
