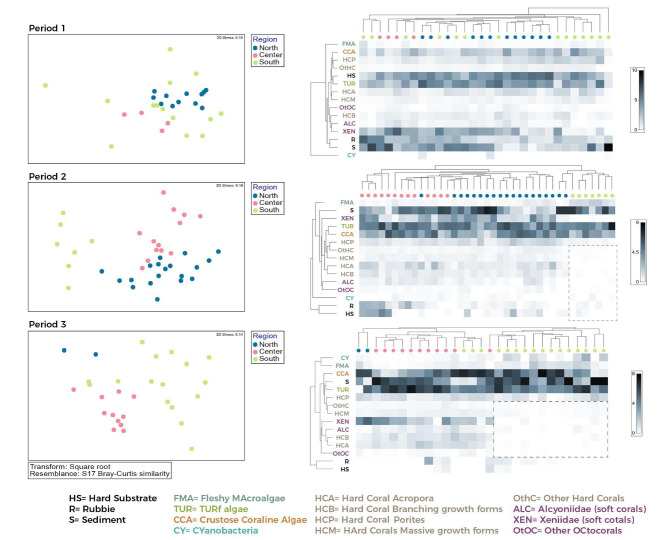
Fig. 3.
Non-metric multidimensional Scaling Plot (NMDS) of the coral reef benthic communities, for the three geographical regions: NRS (blue), CRS (pink) and SRS (green); (A) Period 1: 2014/2015, (B) Period 2: 2016/2017, (C) Period 3: 2018/2019. Hierarchical cluster analysis using the Bray-Curtis dissimilarity index for seven different locations (DU: Duba, AW: Al Wajh, TH: Thuwal, JD: Jeddah, AL: Al Lith, FI: Farasan Islands, FB: Farasan Banks) in three periods (Period 1: 2014/2015, Period 2: 2016/2017, Period 3: 2018/2019.). Heatmaps show the percentage cover of the benthic categories with a cover greater than 2% (hard corals, soft corals, CCA turf algae, algae sand, rubble, pavement/rock); the darker the shade, the higher the percentage cover.

