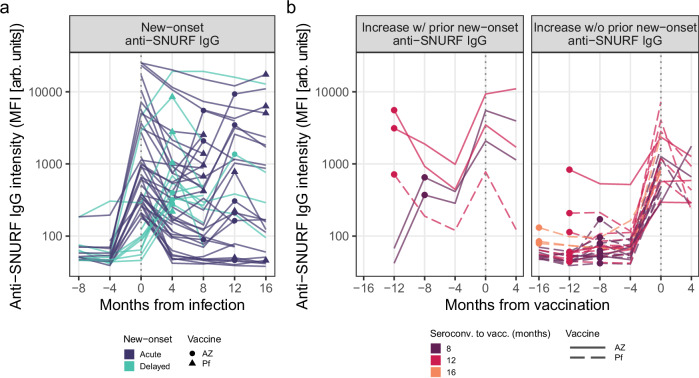
Fig. 4. Increasing levels of anti-SNURF IgG are observed both after infection and after vaccination.
a Antibody trajectories of new-onset anti-SNURF IgG display marked increases at the time of new-onset. Each line depicts the anti-SNURF IgG trajectory of an individual with new-onset anti-SNURF IgG, centered on the time of infection. Line color: mode of new-onset. Points and shape: time of vaccination and vaccine type. b Antibody trajectories of individuals with a fourfold increase of anti-SNURF IgG levels at the time of vaccination (vs 4 months prior). Each line depicts the anti-SNURF IgG trajectory centered on the time of first vaccination. Individuals are separated across panels based on whether they had prior new-onset anti-SNURF IgG (emerging after infection). Line color: time between seroconversion and first vaccination. Points: time of seroconversion. Line type: vaccine type. MFI median fluorescent intensity. AZ AstraZeneca. Pf Pfizer/BioNTech. Source data are provided as a Source Data file.

