Fig. 6.
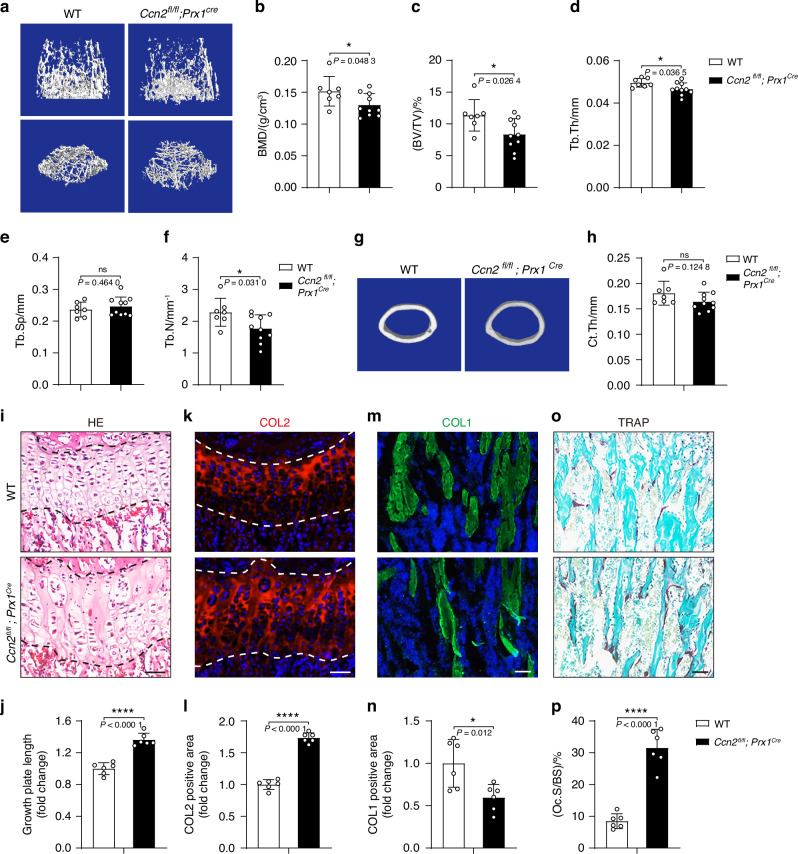
Deletion of CCN2 in mesenchymal progenitor cells leads to decreased bone mass. a–f Micro-CT image of trabecular bones of distal femurs isolated from 6-week-old wild-type and Ccn2fl/fl;Prx1Cre mice, and analysis for bone mineral density (BMD), bone volume per tissue volume (BV/TV), trabecular thickness (Tb.Th), trabecular spacing (Tb.Sp), and trabecular number (Tb.N). Data are represented as mean ± SD (n = 7 for wild-type, n = 10 for Ccn2fl/fl;Prx1Cre). Student’s t test was used. *P < 0.05; ns, not significant. g, h Micro-CT image of cortical bones of mid diaphysis of femurs isolated from 6-week-old mice, and analysis for cortical thickness (Ct.Th). Data are represented as mean ± SD (n = 7 for wild-type, n = 10 for Ccn2fl/fl;Prx1Cre). Student’s t test was used. ns, not significant. i, j Histology of growth plate in femurs of 6-week-old mice. The sections are stained with H/E. Scale bar = 50 μm. Data are represented as mean ± SD (n = 6). Student’s t test was used. **** P < 0.000 1. k, l Immunofluorescence analysis of Col2 of growth plate in femurs of 6-week-old mice. Scale bar = 50 μm. Data are represented as mean ± SD (n = 6). Student’s t test was used. ****P < 0.000 1. m, n Immunofluorescence analysis of Col1 in femurs of 6-week-old mice. Scale bar = 50 μm. Data are represented as mean ± SD (n = 6). Student’s t test was used.*P < 0.05. o, p TRAP staining in femurs of 6-week-old mice. Scale bar = 50 μm. Data are represented as mean ± SD (n = 6). Student’s t test was used. ****P < 0.000 1

