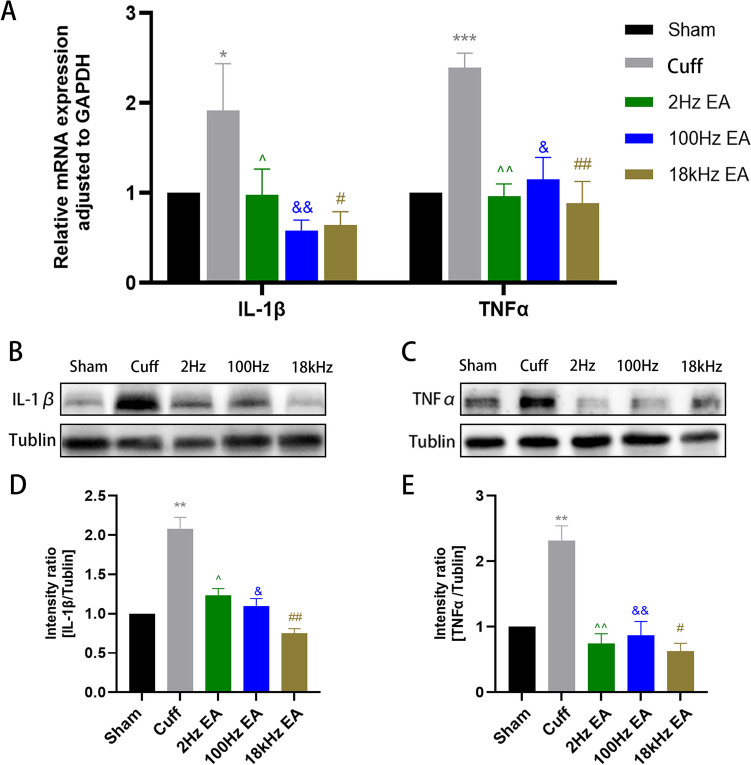
Fig. 5.
The expression of inflammatory cytokines in the spinal cord after different frequency EA. qRT-PCR was employed to evaluate the mRNA expression of IL-1β and TNF-α in the spinal cord. (A) Western blot analysis was performed to assess the protein expression levels of IL-1β and TNF-α in the L4-L6 spinal cord. (B-E) All results were expressed as mean ± SEM and were statistically using one-way ANOVA followed by Tukey’s post-hoc test (n = 6). *p < 0.05, **p < 0.01, ***p < 0.001 compared to the Sham group; ^p < 0.05, ^^p < 0.01, & p < 0.05, && p < 0.01, #p < 0.05, ## p < 0.01 compared to the cuff group

