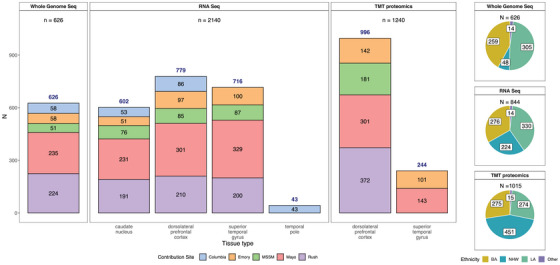
FIGURE 2.

Data types by tissue, site, and individual race and ethnicity. Bar graph depicting the number of samples profiled by each assay (whole genome sequencing, RNAseq, or TMT proteomics). Whole genome sequencing data were generated for 626 donors from various contributing sites (an additional 411 donors had WGS from AMP‐AD 1.0 efforts, not shown here). Similarly, 2140 unique transcriptomics profiles from RNAseq of the caudate nucleus (n = 602), dorsolateral prefrontal cortex (n = 779), superior temporal gyrus (716), and temporal pole (n = 43) from 844 donors were generated. Samples sent to other sites for the swap study are not included. A lone superior temporal gyrus RNAseq sample from Columbia was also not included in this summary. One thousand two hundred forty unique TMT proteomes from dorsolateral prefrontal cortex (n = 996) and superior temporal gyrus (n = 244) were generated from 1015 donors. These include the 307 samples from the AMP‐AD 1.0 efforts to balance batches, as described in the Methods section. Pie charts on the right show the number of donors profiled by ethnoracial categories (BA = Black American, NHW = non‐Hispanic White, LA = Latin American, and Other). These categories were defined as follows: donors whose race was encoded as “Black or African American” and ethnicity as "isHispanic = FALSE" in the individual metadata were treated as "BA." Those with race encoded as White and ethnicity as "isHispanic = FALSE" were categorized as "NHW." The remaining donors, for whom ethnicity was encoded as "isHispanic = TRUE" were treated as "LA." All remaining donors from various other races were encoded as "Other." AMP‐AD, Accelerating Medicines Partnership in Alzheimer's Disease; MSSM, Mount Sinai School of Medicine; RNAseq, RNA sequencing; TMT, isobaric tandem mass tag; WGS, whole genome sequencing.
