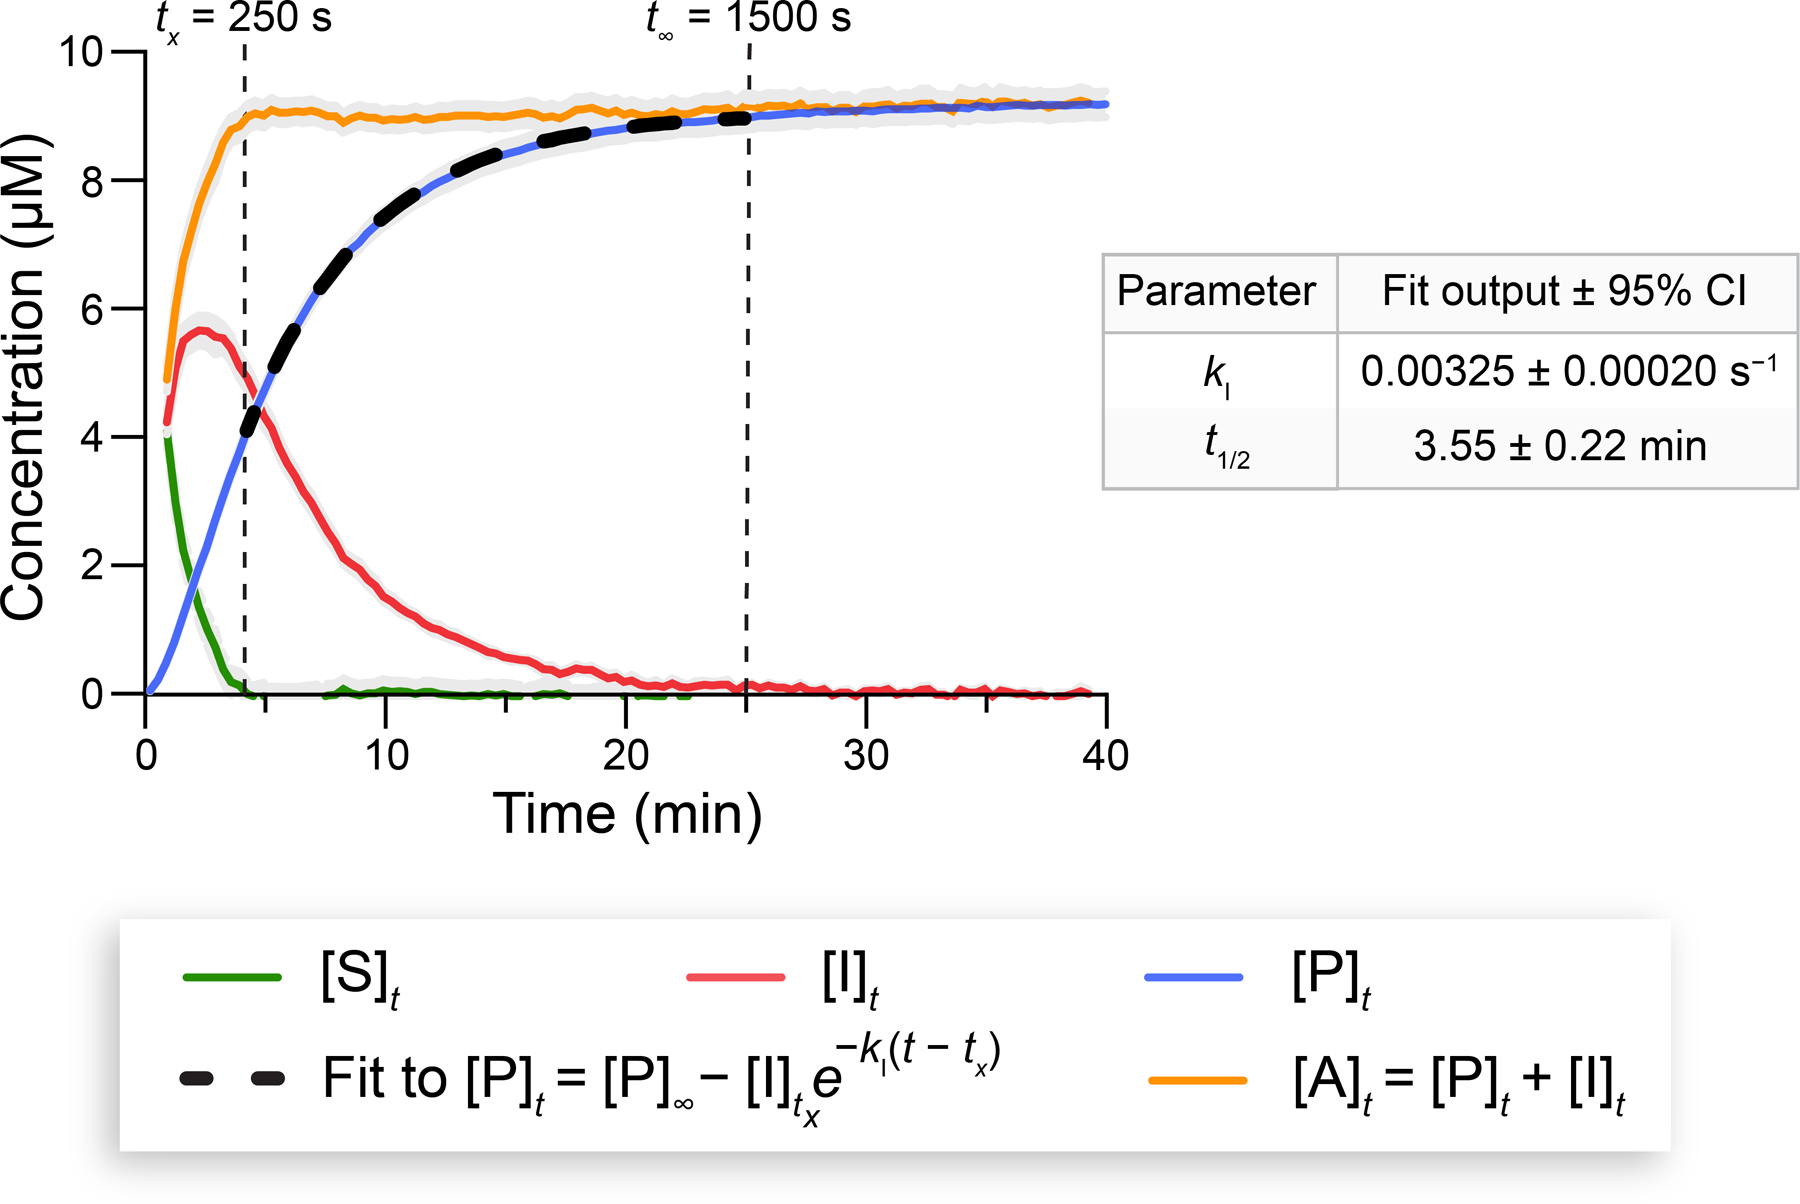
Figure 8.

Progress curves of reaction species associated with Opt–3 (10 µM) cleavage by PLE at 37 °C. Fitting to eq 2 enabled the determination of the values of and (±95% CI) for Opt–2 and Opt–3. See Figure S25A for the corresponding fluorescence curves. The Glu-C assay was performed in 10 mM HEPES–NaOH buffer, pH 7.4, containing DMF (1.5% v/v) and Triton X-100 (0.8% w/v). Gray areas represent the SD; n = 2 independent replicates, n = 3 technical replicates. and fitting parameters are listed in Table S2.
