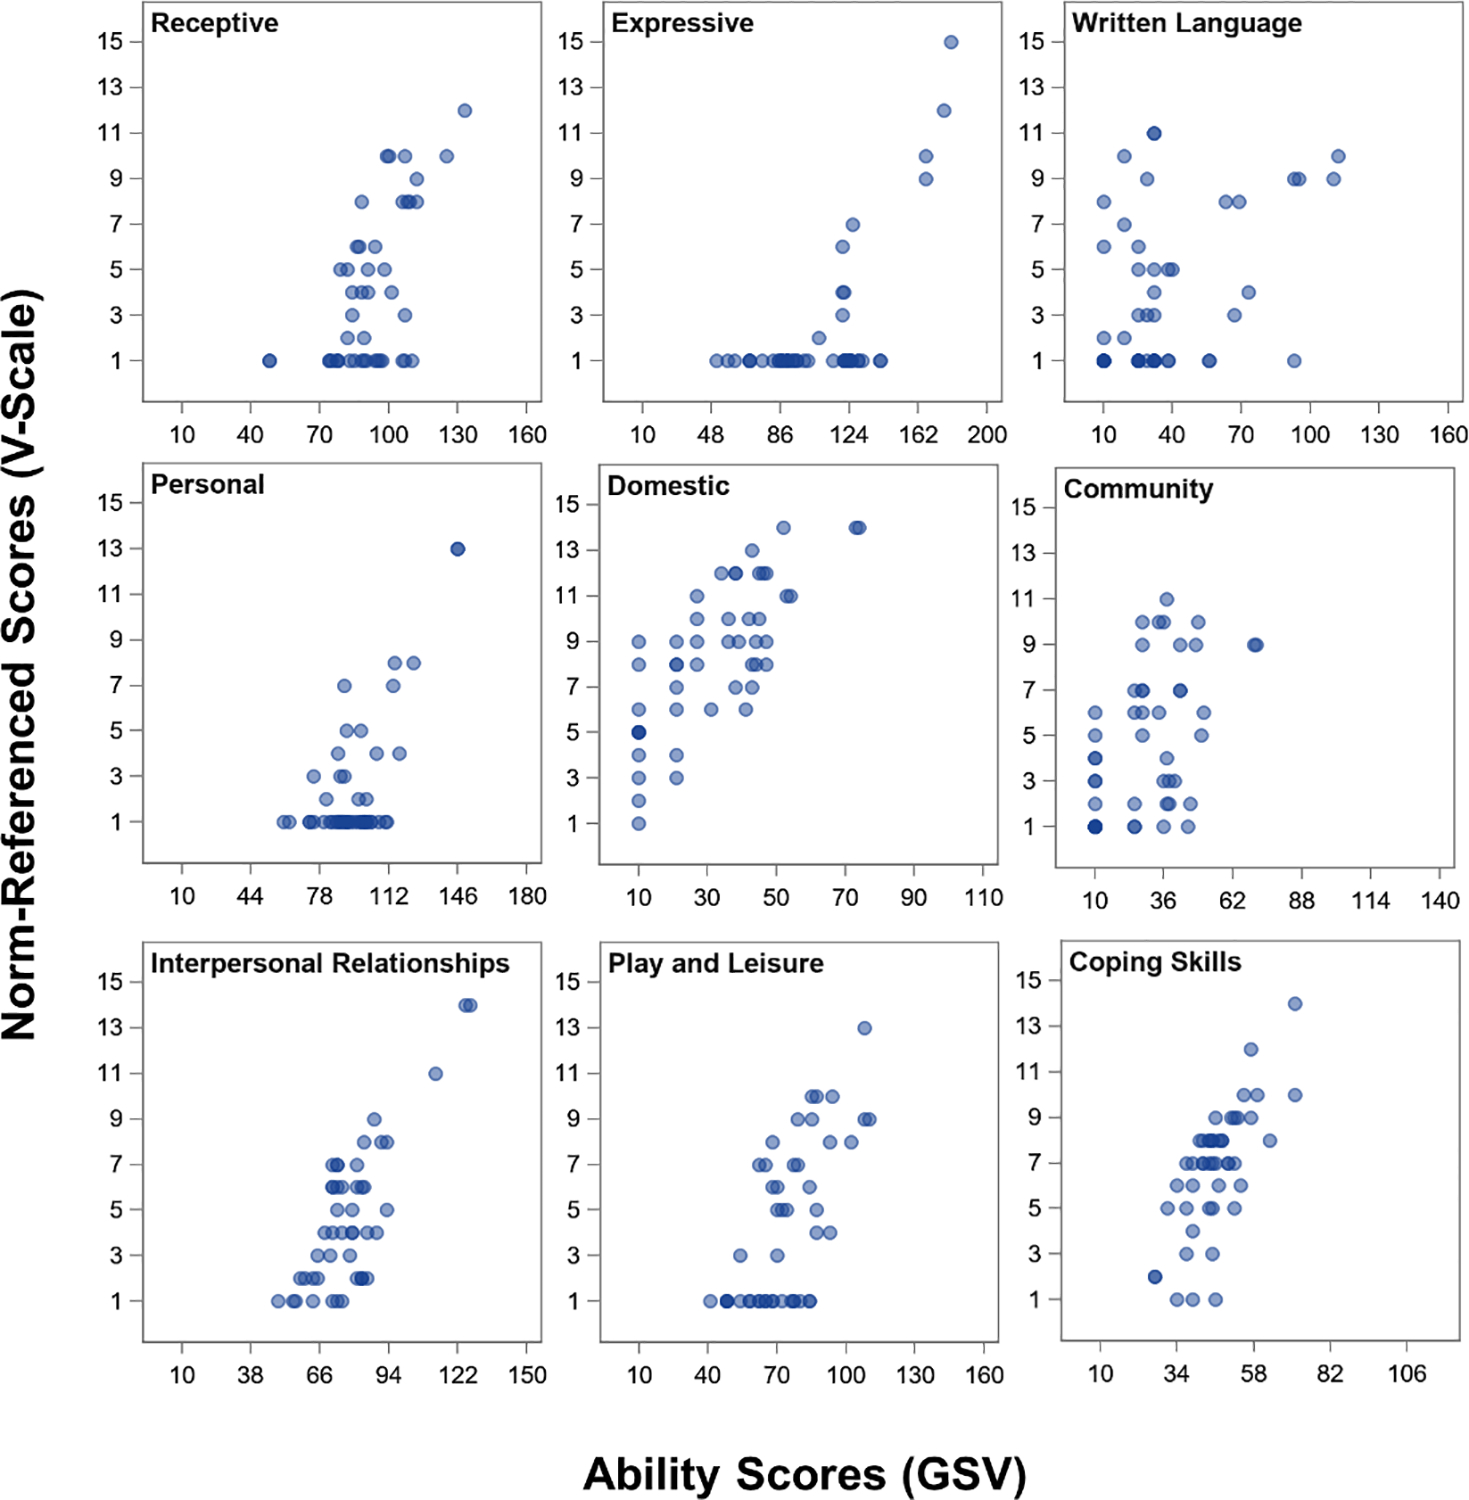
Figure 1. Floor effects in the Vineland-3.

GSV = growth scale values. Baseline and 6-month Vineland-3 scores are plotted for N=29 individuals. Floor effects are characterized by “piling up” of markers at the lowest possible score on a scale. Markers are transparent; darker shades of blue indicate more observations at given location. Ranges of the X-axis reflect the actual range of possible GSV for a subscale.
