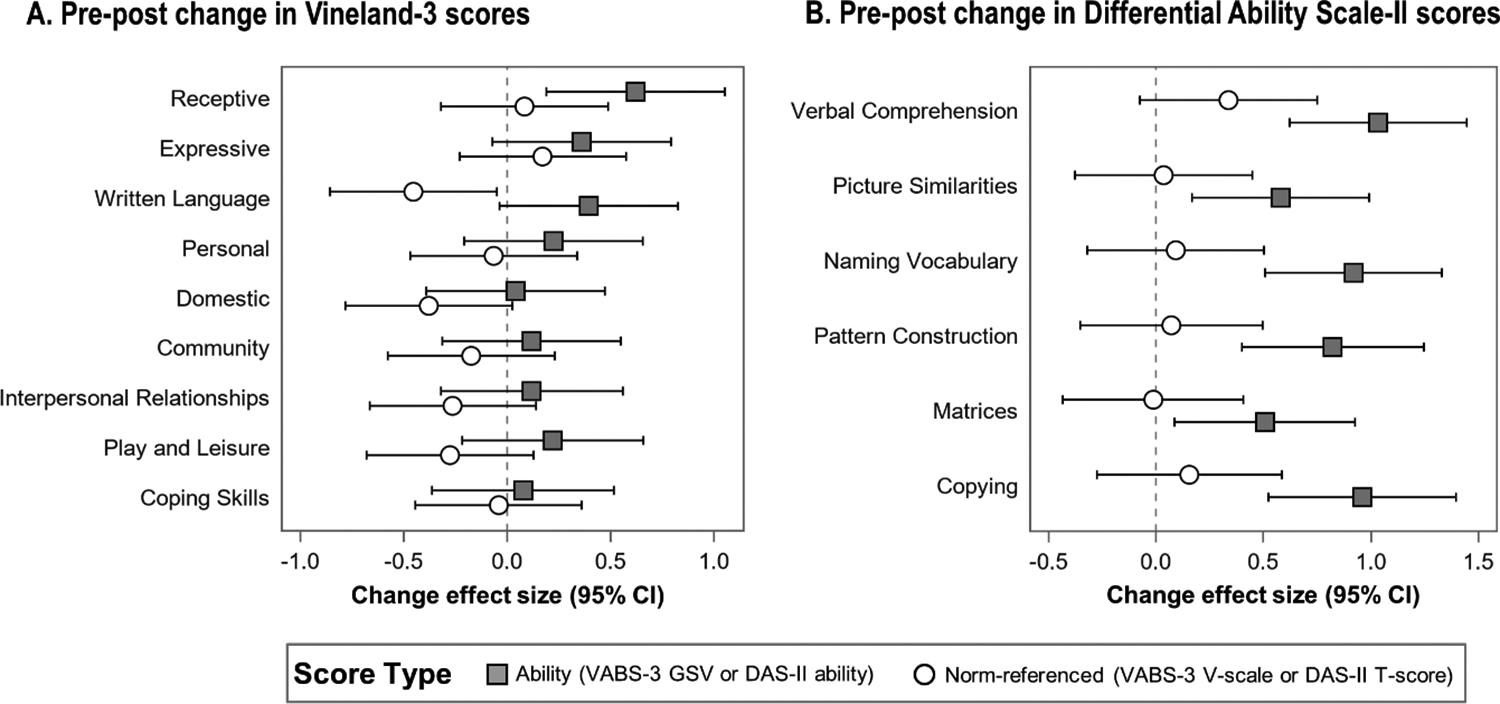
Figure 2. Within-subject change effect sizes in ability scores versus norm-referenced scores.

GSV = growth scale value; VABS-3 = Vineland Adaptive Behavior Scales, 3rd edition; DAS-II = Differential Ability Scale, Second Edition. Panel A shows the standardized effect size for baseline to 6-month change among 29 individuals. Panel B shows the standardized effect size for baseline to 1-year change among 26 individuals. For both panels, a negative effect size reflects a decrease in score and a positive effect size reflects an increase.
