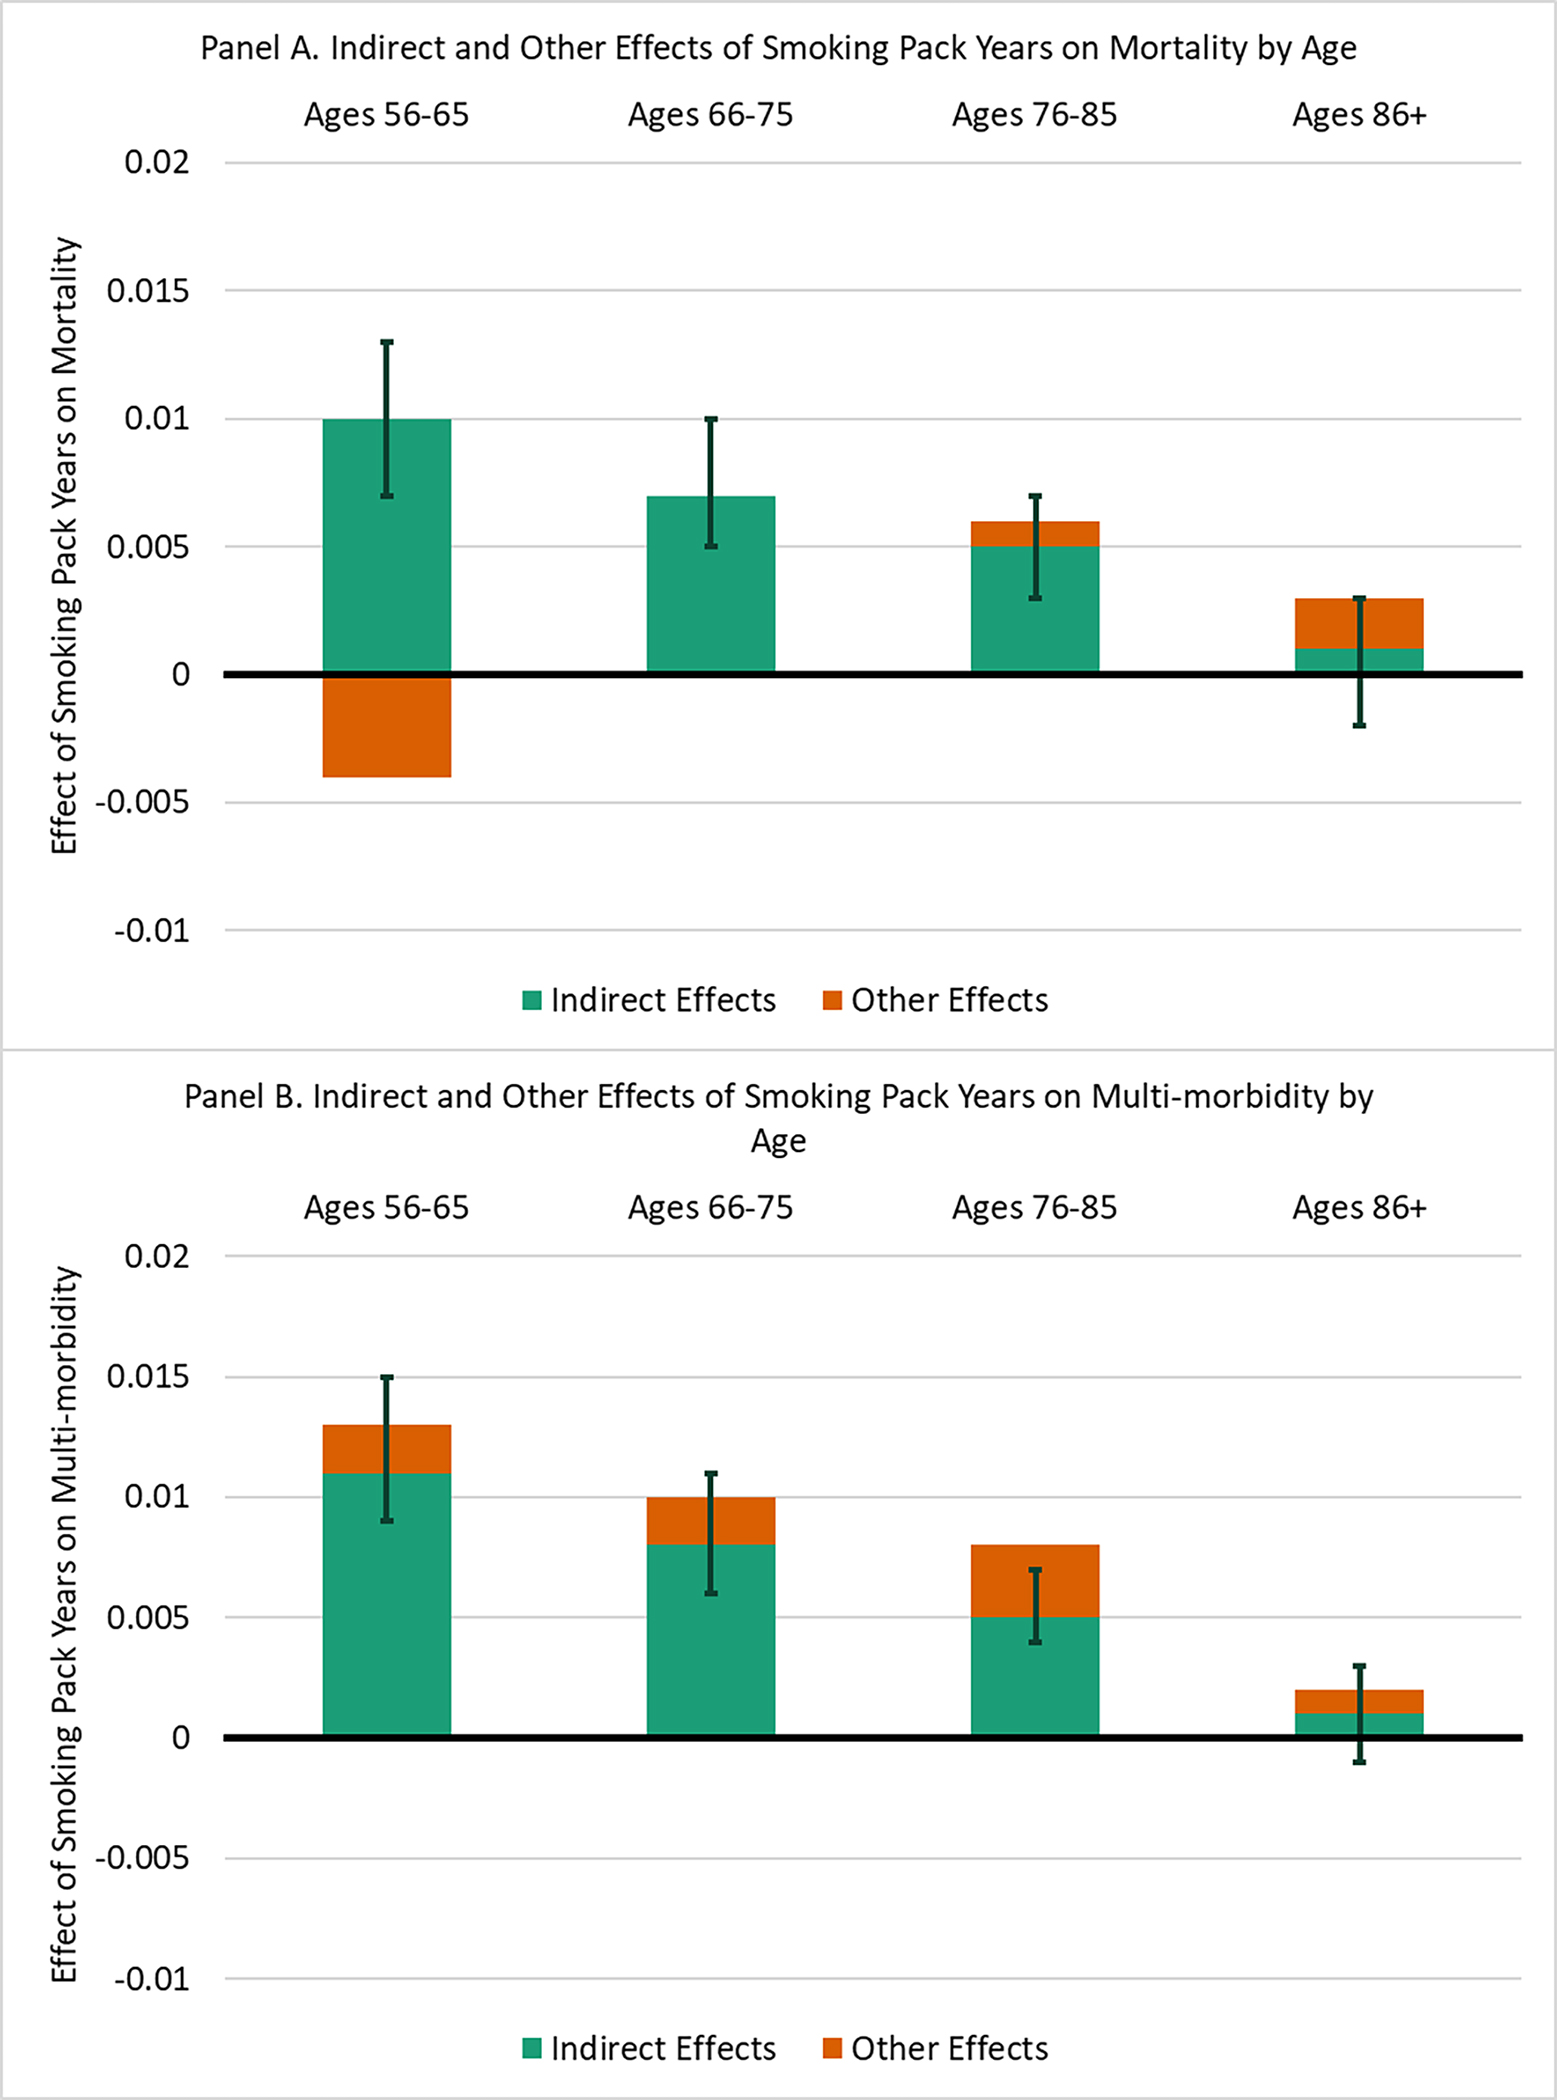
Figure 4.

Moderated mediation results.
Note: unstandardized results shown. Estimates and 95% confidence intervals calculated from results of SEMs in Figures 2 and 3. The full bar represents the total effect of lifetime smoking pack years for each age group. The green section represents the indirect effect of pack years through epigenetic aging. The orange section represents all other effects. Some direct effects of pack years on mortality are in the opposite direction of the total effect. 95% confidence intervals for indirect effects from bias-corrected bootstrap procedure.
