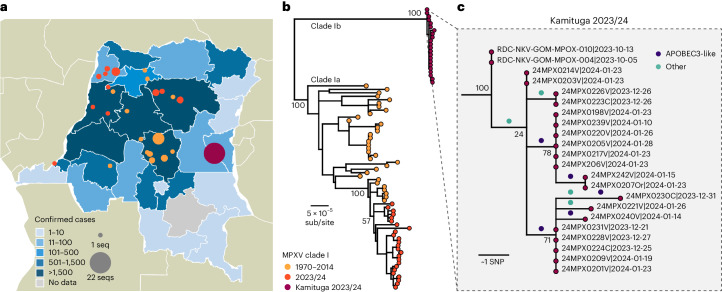
Fig. 1. Mapping number of reported mpox cases and genomics analysis, Kamituga, DRC.
a, Map of the DRC with provinces colored by the number of reported cases. MPXV genomes available are indicated by colored circles (31 January 2024). These are placed at the centroid of the town, the health zone or the province depending on the precision of the recorded location. b, Maximum likelihood phylogeny of clade I genomes, including those from the present study (indicated as 2023/24 and Kamituga samples), with all previously sequenced genomes publicly available on GenBank. A version of this phylogeny where individual tips are labeled with accession numbers, locations and dates can be found in Supplementary Figs. 1 and 2. c, The Kamituga cluster with reconstructed mutations indicated on the branches. Mutations are colored by whether they are consistent with APOBEC3 deamination (dark blue) or not (green). sub/site, substitutions per site.

