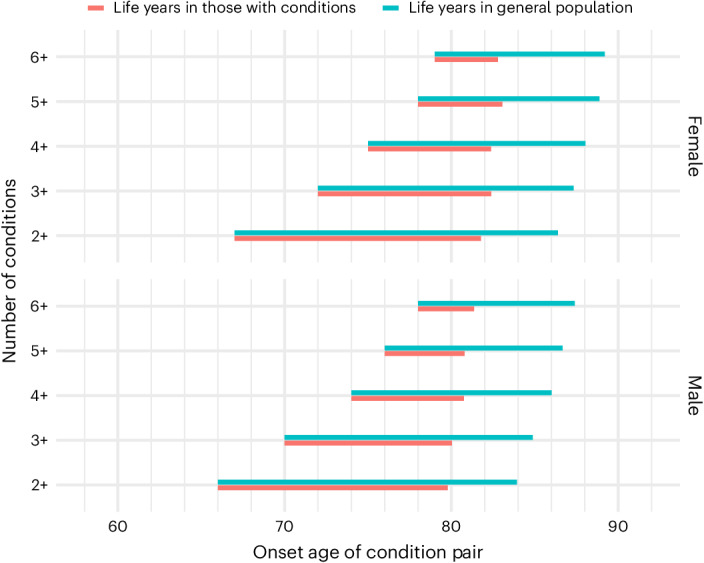
Fig. 3. Median age of onset and years of life spent and lost associated with the number of conditions (including diabetes) among women and men in England.

Segment in red represents period from median age of onset of condition and death among persons who develop the noted number of conditions. Segment in blue represents the period of expected life from the equivalent age among the general population with and without comorbid conditions.
