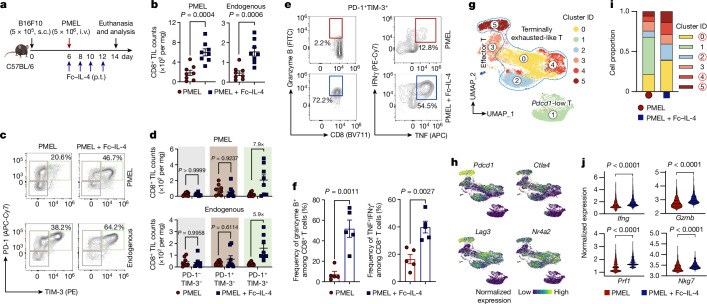
Fig. 1. Fc–IL-4 enriches functional CD8+ TTE cells in the TME.
a–f, C57BL/6 mice bearing B16F10 tumours received ACT of PMEL T cells (5 × 10⁶, i.v.) followed by administration of Fc–IL-4 (20 µg, p.t.) or PBS every other day for four doses. Mice were euthanized on day 14 and the tumour tissues were collected for analysis by flow cytometry. Data are a single representative of two independent experiments. All data represent mean ± s.e.m. Shown are the experimental timeline (a), cell counts of PMEL or endogenous CD8+ TILs (b) (n = 8 animals), representative flow cytometry plots showing the frequencies of tumour-infiltrating CD8+ TTE cells (PD-1+TIM-3+) among PMEL or endogenous CD8+ TILs (c), cell counts of three subpopulations among PMEL or endogenous CD8+ TILs (d) (n = 8 animals), and representative flow cytometry plots (e) and frequencies (f) of granzyme B+ and TNF+IFNγ+ among tumour-infiltrating CD8+ TTE cells (n = 5 animals). g–j, C57BL/6 mice bearing B16F10 tumours received ACT of PMEL T cells (5 × 10⁶, i.v.) followed by administration of Fc–IL-4 (20 µg, p.t.) or PBS every other day for four doses in total. Mice were euthanized on day 14, tumour tissues were collected, and PMEL CD8+ T cells were sorted for scRNA-seq (n = 5 animals). g, UMAP clustering of all the PMEL CD8+ TILs. h, Indicated co-inhibitory gene marker expression on the UMAP. i, Comparison of cell proportion in each cluster. j, Comparison of functional gene expression in the terminally exhausted-like T cells. Statistical analyses are performed using two-sided unpaired Student’s t-test. Schematic in a created using BioRender (https://Biorender.com).

