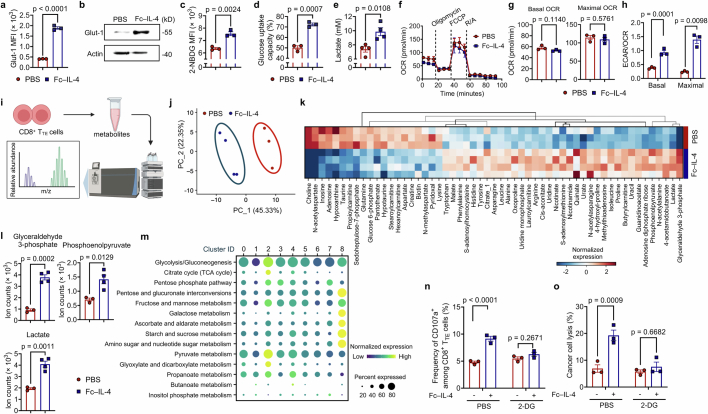
Extended Data Fig. 7. Fc–IL-4 enhances glycolytic metabolism of CD8+ TTE cells in vitro and in vivo.
a-e, Ex vivo-induced CD8+ TTE cells were re-stimulated by dimeric anti-CD3 antibody (0.5 µg ml−1) for 48 h in the presence or absence of Fc–IL-4 (n = 3 biological replicates). Shown are the Glut-1 MFI (a), WB images of Glut-1 (b), glucose uptake capacity measured by the 2-NBDG assay (c) and the Glucose Colorimetric Detection Kit (Invitrogen™, EIAGLUC) (d), and extracellular lactate concentration (e). f, Real-time OCR analysis of ex vivo-induced CD8+ TTE cells re-stimulated by dimeric anti-CD3 antibody (0.5 µg ml−1) for 48 h in the presence or absence of Fc–IL-4 (n = 3 biological replicates). g, Average basal and maximal OCR calculated from f. pmol, pico mole. h, The ratio of basal and maximal ECAR to OCR. i-l, Ex vivo-induced CD8+ TTE cells were re-stimulated by dimeric anti-CD3 antibody (0.5 µg ml−1) and treated with Fc–IL-4 (n = 4 biological replicates) or PBS (n = 3 biological replicates). The metabolites were collected for metabolomics analysis. Shown are the schematic illustration of metabolomic analysis (i), Principal Component Analysis (PCA) of 120 metabolites of CD8+ TTE cells (j), and heatmap showing the metabolic expression pattern of each sample in the Fc–IL-4 and PBS groups (k). The fold change between Fc–IL-4 vs. PBS was calculated for each metabolite, and only metabolites with significant differences (p < 0.05) were included. Shown are the cellular ion counts of glyceraldehyde 3-phosphate, phosphoenolpyruvate, and lactate in ex vivo-induced CD8+ TTE cells (l). Multiple pathway targeted analysis results of metabolites are provided in Supplementary Table 1. m, Experimental setting was described in Fig. 1g. Shown is the systematic expression comparison of carbohydrate metabolisms across all identified clusters in Fig. 4d, with each metabolic pathway name indicated. The size of circle represents proportion of single cells expressing the pathway, and the colour shade indicates normalized expression level. Genes defining each pathway are provided in Supplementary Table 2. n, o, B16F10 tumour cells were co-cultured with ex vivo-induced CD8+ TTE cells in the presence or absence of Fc–IL-4 with or without the treatment of 2-DG (10 mM) (n = 3 biological replicates). Shown are the frequencies of CD107a+ among CD8+ T cells (n) and percent of cancer cell lysis (o). Data are one representative of three independent experiments. All data represent mean ± s.e.m. and are analysed by two-sided unpaired Student’s t-test. Schematic in i created using BioRender (https://Biorender.com).

