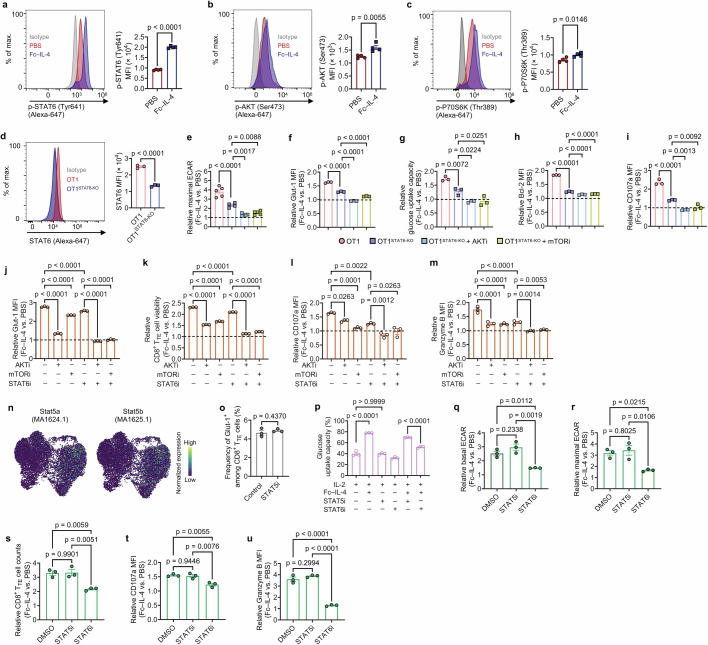
Extended Data Fig. 9. Fc–IL-4 enhances the glycolytic metabolism of CD8+ TTE cells through STAT6 signalling and PI3K-AKT-mTOR axis.
a-c, Ex vivo-induced PMEL CD8+ TTE cells were re-stimulated by dimeric anti-CD3 antibody (0.1 µg ml−1) in the presence or absence of Fc–IL-4 (n = 4 biological replicates) for 0.5 h. Shown are the representative flow cytometry plots and MFI of p-STAT6 (a), p-AKT (Ser473) (b), p-P70S6K (Thr389) (c). d, STAT6 was knock-out in OT1 T cells using CRISPR-Cas9 gene editing (n = 3 biological replicates). Shown are representative flow cytometry plots and MFI of STAT6. e-i, Ex vivo-induced OT1 and OT1STAT6-KO CD8+ TTE cells were re-stimulated by dimeric anti-CD3 antibody (0.5 µg ml−1) with AKT inhibitor VIII (HY-10355, 1 µM), mTOR inhibitor (Rapamycin, 100 nM), or no inhibitors, in the presence or absence of Fc–IL-4 for 24 h (n = 3 biological replicates). Shown are relative maximal ECAR (e), Glut-1 MFI (f), glucose uptake capacity (g), Bcl-2 MFI (h), and CD107a MFI (i) in the Fc–IL-4 treatment group normalized by that in the PBS group. j-m, Ex vivo-induced PMEL CD8+ TTE cells were re-stimulated by dimeric anti-CD3 antibody (0.5 µg ml−1) and treated with AKT inhibitor VIII (HY-10355, 1 µM), mTOR inhibitor (Rapamycin, 100 nM), or STAT6 inhibitor (AS1517499, 50 nM) in the presence or absence of Fc–IL-4 for 24 h (n = 3 biological replicates). Shown are relative Glut-1 MFI (j), T cell viability (k), CD107a MFI (l), and Granzyme B MFI (m) in the Fc–IL-4 treatment group normalized by that in the PBS group. n, Visualization of motif activity expression for Stat5a (MA1624.1) and Stat5b (MA1625.1) on the joint UMAP in Fig. 4i. o-u, Ex vivo-induced PMEL CD8+ TTE cells were re-stimulated by dimeric anti-CD3 antibody (0.5 µg ml−1) and treated with inhibitors for STAT6 (AS1517499, 50 nM) or STAT5 (Bestellnummer 573108, 25 µM) in the presence or absence of Fc–IL-4 (n = 3 biological replicates). Shown are frequency of Glut-1+ among PMEL CD8+ TTE cells (o), glucose uptake capacity of PMEL CD8+ TTE cells (p), and relative level of basal ECAR (q), maximal ECAR (r), T cell counts (s), CD107a MFI (t), and Granzyme B MFI (u) in the Fc–IL-4 treatment group normalized by that in the PBS group. Data are one representative of three independent experiments. All data represent mean ± s.e.m. and are analysed by two-sided unpaired Student’s t-test (a-d, and o), or by one-way ANOVA and Tukey’s test (e-m, and p-u).

