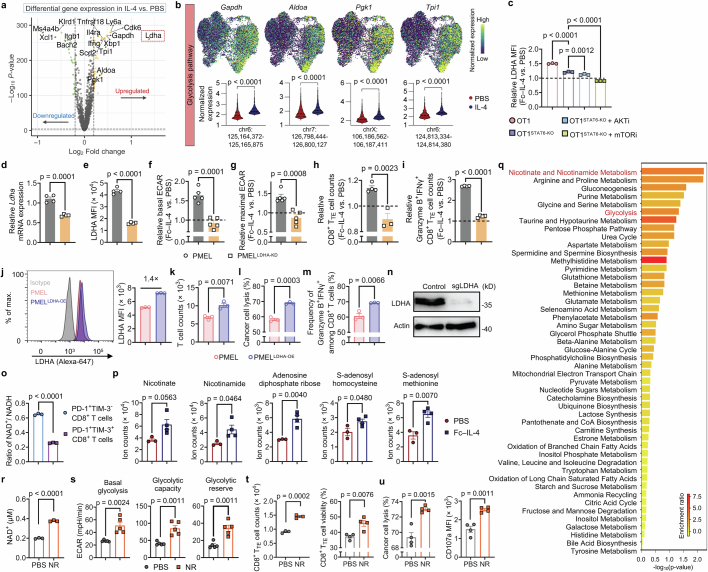
Extended Data Fig. 10. Fc–IL-4 reinvigorates CD8+ TTE cells by enhancing LDHA-dependent glycolysis and promoting the cellular NAD+ level.
a, b, Experimental setting was described in Fig. 4i. Shown is a volcano plot showing differential gene expression between IL-4 vs. PBS-treated PMEL CD8+ TTE cells (a), and expression of glycolysis pathway gene markers on the joint UMAP along with comparisons of corresponding accessible peaks between conditions (b). c, Relative expression of LDHA in Fc–IL-4-treated ex vivo-induced OT1 and OT1STAT6-KO CD8+ TTE cells (normalized by that in PBS group) with or without indicated inhibitors (n = 3 biological replicates). d-i, WT PMEL or PMELLDHA-KD T cells were re-stimulated by dimeric anti-CD3 antibody (0.5 µg ml−1) in the presence or absence of Fc–IL-4 (n = 4 biological replicates). Shown are the relative transcriptome level (d) and MFI of LDHA (e) in WT PMEL and PMELLDHA-KD T cells, and the relative basal (f) and maximal (g) ECAR, and relative counts of CD8+ TTE cells (h) and Granzyme B+IFNγ+ polyfunctional CD8+ TTE cells (i) in the Fc–IL-4 treatment group normalized by that in the PBS group. j-m, WT PMEL or PMELLDHA-OE T cells were co-cultured with B16F10 for 48 h (n = 3 biological replicates). Shown are representative flow cytometry plots and LDHA MFI (j), T cell counts (k), percent of cancer cell lysis (l), and frequencies of Granzyme B+IFNγ+ (m) among WT PMEL and PMELLDHA-OE T cells. n, WB images of LDHA showing the LDHA knock-out in OT1LDHA-KO T cells. o, PD-1+TIM-3- and PD-1+TIM-3+ PMEL T cells were sorted from ex vivo-induced PMEL T cells. The cellular level of NAD+ and NADH was assessed in both cell subsets. Shown is the ratio of NAD+ to NADH in the two cell subsets (n = 3 biological replicates). p, q, Experimental setting was described in Extended Data Fig. 7i. Shown are the cellular ion counts of metabolites engaged in nicotinate and nicotinamide metabolic pathways (p), and metabolic pathways enriched in Fc–IL-4 treated cells vs. PBS control group using metabolite set enrichment analysis (q). r, The cellular NAD+ level of ex vivo-induced CD8+ TTE cells with supplementation of a NAD+ precursor, nicotinamide riboside (NR) (100 µM) (n = 3 biological replicates). s, Ex vivo-induced CD8+ TTE cells were re-stimulated by dimeric anti-CD3 antibody (0.5 μg ml−1) for 48 h in the presence or absence of NR (100 μM). Shown are average basal glycolysis, glycolytic capacity, and glycolytic reserve analysed from Fig. 5m (n = 5 biological replicates). t, Ex vivo-induced CD8+ TTE cells were re-stimulated by dimeric anti-CD3 antibody (0.5 µg ml−1) for 48 h in the presence or absence of NR (100 µM). Shown are the counts (n = 3 biological replicates) and viability (n = 4 biological replicates) of CD8+ TTE cells. u, Ex vivo-induced CD8+ TTE cells were co-cultured with B16F10 tumour cells for 48 h in the presence or absence of NR (100 µM) (n = 4 biological replicates). Shown are the percent of cancer cell lysis and CD107a MFI of CD8+ TTE cells. Data are one representative of three independent experiments. All data represent mean ± s.e.m. and are analysed by two-sided unpaired Student’s t-test (b, d-m, and o-u), or one-way ANOVA and Tukey’s test (c).

