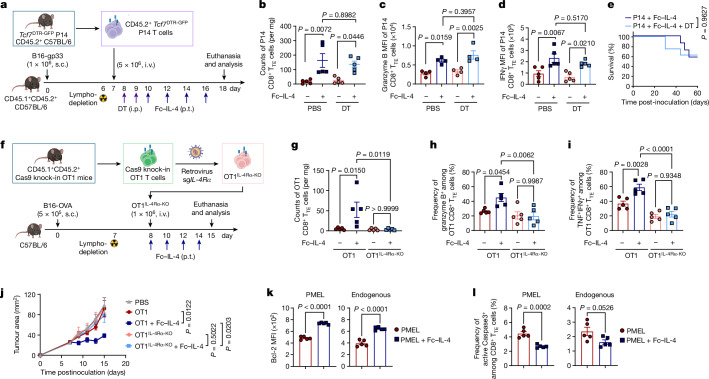
Fig. 3. Fc–IL-4 enhances the survival of CD8+ TTE cells directly through IL-4Rα signalling.
a–e, CD45.1+CD45.2+ C57BL/6 mice bearing B16-gp33 tumours received ACT of activated CD45.2+ Tcf7DTR-GFP P14 T cells (5 × 10⁶, i.v.) 1 day post-lymphodepletion, followed by the injection of diphtheria toxin (DT) (1 µg × 2, i.p.) and subsequent treatment of Fc–IL-4 (20 µg, p.t.) or PBS every other day for four doses. Shown are the experimental timeline (a), counts of tumour-infiltrating P14 CD8+ TTE cells (Tcf7DTR-GFP−PD-1+TIM-3+) (b) (n = 5 animals), mean fluorescence intensity (MFI) of granzyme B (c) (n = 4 animals) and IFNγ (d) (n = 5 animals) of tumour-infiltrating P14 CD8+ TTE cells, and Kaplan–Meier survival curves of mice (n = 8 animals) (e). f–j, Mice bearing B16-OVA tumours received ACT of activated WT OT1 or OT1IL-4Rα-KO T cells (1 × 10⁶, i.v.) 1 day after lymphodepletion followed by treatment with Fc–IL-4 (20 µg, p.t.) or PBS every other day for four doses (n = 5 animals). Shown are the experimental timeline (f), counts of tumour-infiltrating OT1 CD8+ TTE cells (g), frequencies of granzyme B+ (h) and TNF+IFNγ+ (i) among tumour-infiltrating OT1 CD8+ TTE cells, and average tumour growth curves (j). k,l, Experimental setting was similar to that described in Fig. 1a except that BrdU (1 mg, i.p.) was injected 24 h before tumour tissue collection (n = 5 animals). Shown are Bcl-2 MFI (k) and frequencies of active Caspase-3+ cells (l) among PMEL and endogenous CD8+ TTE cells. Data are a single representative of two independent experiments. All data represent mean ± s.e.m. and are analysed by one-way ANOVA and Tukey’s test (b–d and g–j), log-rank test (e) or two-sided unpaired Student’s t-test (k and l). Schematics in a,f created using BioRender (https://Biorender.com).

