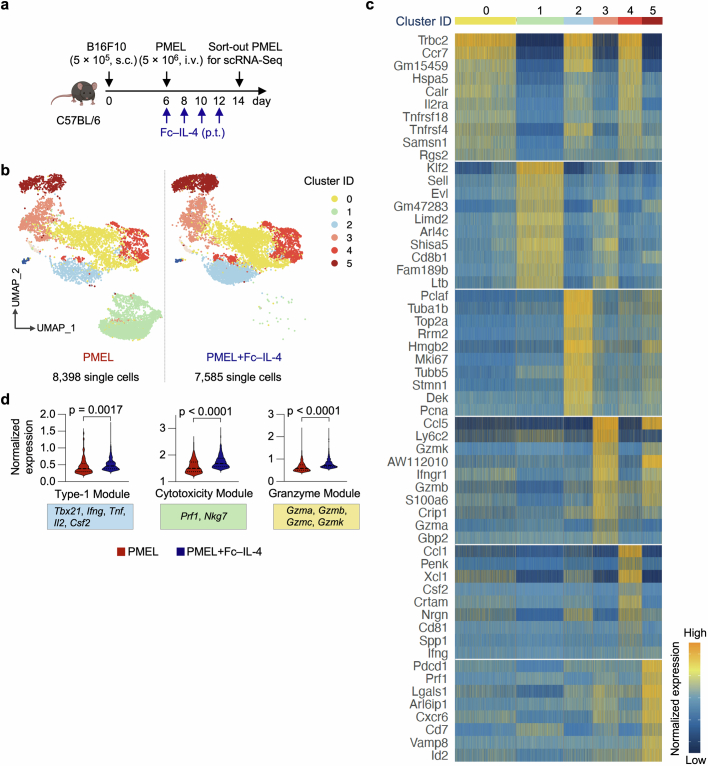
Extended Data Fig. 3. Single-cell RNA-seq analysis of antigen-specific CD8+ T cells treated with Fc–IL-4.
a, Schematic of the experimental setting (as described in Fig. 1g). b, UMAP clustering of all the antigen-specific PMEL CD8+ T cells, split by the treatment condition (PMEL or PMEL + Fc–IL-4). c, Heatmap of differentially expressed genes defining the top 6 identified clusters. d, Comparison of functional gene module expression of all the terminally exhausted-like cells from PMEL or PMEL + Fc–IL-4 group. Genes defining each group are listed below. Statistical analyses are performed using two-sided unpaired Student’s t-test. Schematics in a created using BioRender (https://Biorender.com).

