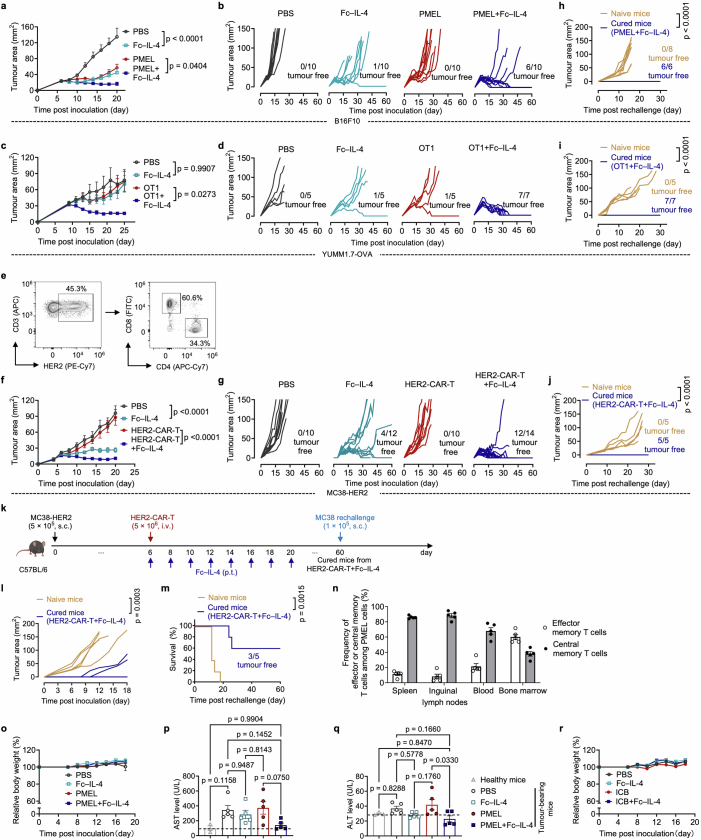
Extended Data Fig. 4. Fc–IL-4 potentiates ACT and ICB immunotherapies and induces long-term immune memory without overt toxicities.
a-j, Experimental setting was described in Fig. 2a. Shown are average and individual tumour growth curves of mice bearing B16F10 (a, and b) (n = 10 animals), YUMM1.7-OVA (c, and d) (n = 7 animals), and MC38-HER2 (f, and g) (n = 14 animals) tumours. HER2-CAR-T cells were analysed by flow cytometry for the frequency of CD4+ and CD8+ T cells prior to transfer (e). Shown are individual tumour growth curves of naive or cured mice re-challenged with B16F10 (h) (n = 6 animals), YUMM1.7-OVA (i) (n = 7 animals), and MC38-HER2 (j) (n = 5 mice) tumour cells. k-m, Experimental setting was similar to that described in Fig. 2a except that the surviving mice were rechallenged with the parental cell line, MC38. Shown are the experimental timeline (k), tumour growth curves (l), and survival curves (m) of the rechallenged mice (n = 5 animals). n, Experimental setting was described in Fig. 2a (n = 5 animals). Surviving mice from the combinatory treatment were euthanized 120 days post-treatment and various tissues were collected for flow cytometry analysis. Shown is the frequencies of effector memory (defined as CD44+CD62L−) and central memory (defined as CD44+CD62L+) T cells among PMEL T cells in different tissues. o, Experimental setting was described in Fig. 2a. Shown is the relative body weight of B16F10 tumour-bearing mice. p, q, Experimental setting was similar to that described in Fig. 1a and the peripheral blood was collected on day 14 for AST and ALT liver enzyme assays (n = 5 animals). Shown are serum AST (p) and ALT (q) levels of B16F10 tumour-bearing mice. r, Experimental setting was described in Fig. 2h (n = 5 animals). Shown is the relative body weight of MC38 tumour-bearing mice. Data are one representative of two independent experiments. All data represent mean ± s.e.m. and are analysed by one-way ANOVA and Tukey’s test (a, c, f, p, and q), two-sided unpaired Student’s t-test (h-j, and l), or log-rank test (m). Schematics in k created using BioRender (https://Biorender.com).

