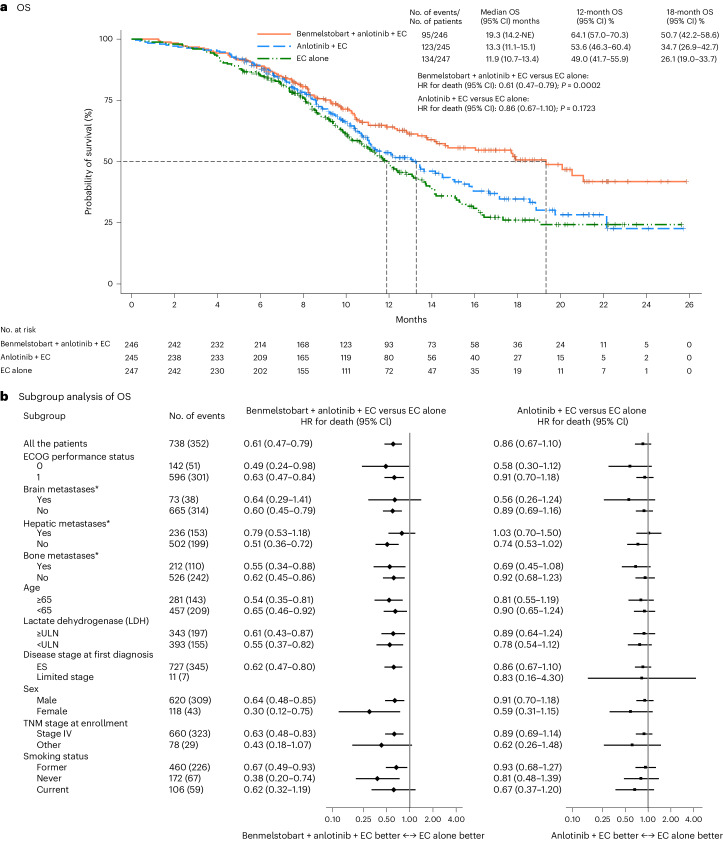
Fig. 2. OS in ITT population.
a, The Kaplan–Meier curves for OS in three treatment groups. The tick marks indicate censored data. Differences between the treatment groups were evaluated with the stratified log-rank test. P values are two-sided. b, The subgroup analysis of OS. A stratified Cox regression model was used to estimate the HR for death and 95% CIs. The circles indicate HR among subgroups of patients, the horizontal lines indicate corresponding 95% CIs and the vertical dotted line indicates the HR for the overall population. *Metastatic lesions were categorized on the basis of their presence or absence. Any patient with liver metastasis, regardless of whether it was the sole metastatic site or coexisting with other metastases, was included in the liver metastasis group for analysis. ULN, upper limit of normal; TNM, tumor, node, metastasis.

