
Extended Data Fig. 1. Patient-reported outcomes of health-related quality of life.
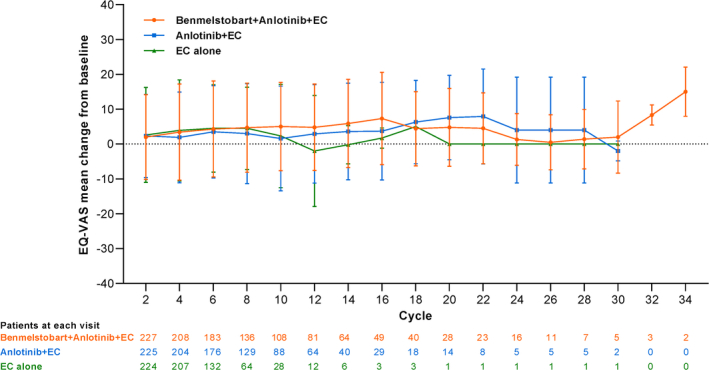
Mixed model repeated measures change from baseline in least squares means for Benmelstobart and anlotinib plus EC, anlotinib plus EC, and EC alone in the overall population. Data are presented as mean values +/− standard deviation. At each cycle data are based on (n/N) participants where n denotes the number of participants completing a section of the questionnaire at a specific cycle and N the total number of participants reaching that cycle. Note: In the intention-to-treat population across all treatment groups, there was an overall increase in the mean change from baseline over time in EuroQol visual analogue scale (EQ-VAS) scores through week 34 (indicating improvements). But there were no significant differences in EQ-VAS scores between the study groups at each visit (P > 0.05 at all visits). Within the benmelstobart and anlotinib plus EC group, there was an improvement from baseline starting at cycle 2 (2.0 ± 12.2; P = 0.0128) through cycle 8 (4.7 ± 12.8; P < 0.0001). Within the anlotinib plus EC group, there was an improvement from baseline starting at cycle 2 (2.3 ± 11.9; P = 0.0052) through cycle 8 (3.0 ± 14.3; P = 0.0255). Within the EC group, there was an improvement from baseline starting at cycle 2 (2.6 ± 13.6; P = 0.0011) through cycle 6 (4.5 ± 12.5; P = 0.0001). EC = Etoposide/carboplatin.