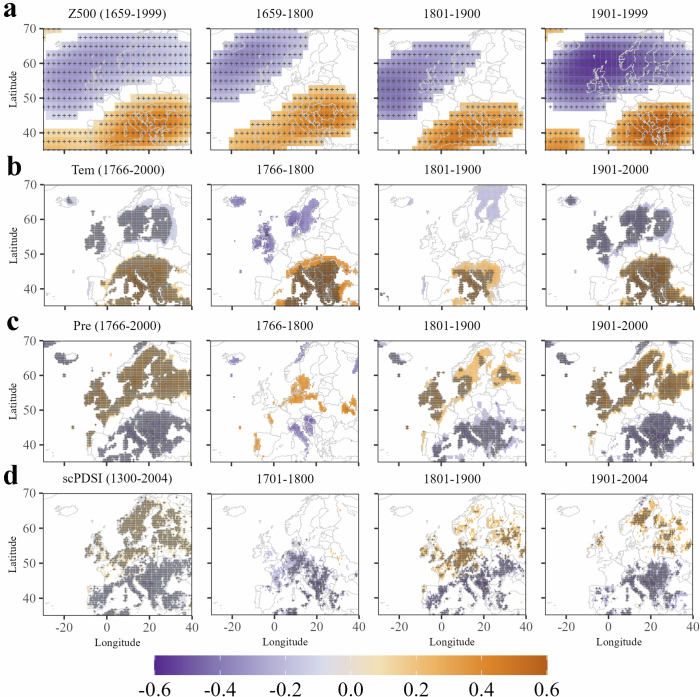
Extended Data Fig. 5. Spatial correlations between the summer EU JSL reconstruction and gridded July-August climate reconstructions for Europe.
(a) July-August 500 hPa geopotential height (Z500)35 for 1659–1999 ce; (b) July-August temperature36 for 1766–2000 ce; (c) July-August precipitation36 for 1766–2000 ce; and (d) June-July-August Old World Drought Atlas (OWDA) self-calibrating Palmer Drought Severity Index (scPDSI)37 for 1300–2004 ce. Panels in the far-left column show the entire period of overlap between the climate data and the EU JSL reconstruction, followed by the data over three roughly 100-year subperiods: the 18th, 19th, and 20th centuries (from left to right). Colored correlation maps are shown only where p ≤ 0.1 and areas with statistically significant values after controlling for the false discovery rate (αFDR ≤ 0.1) are cross-hatched.

