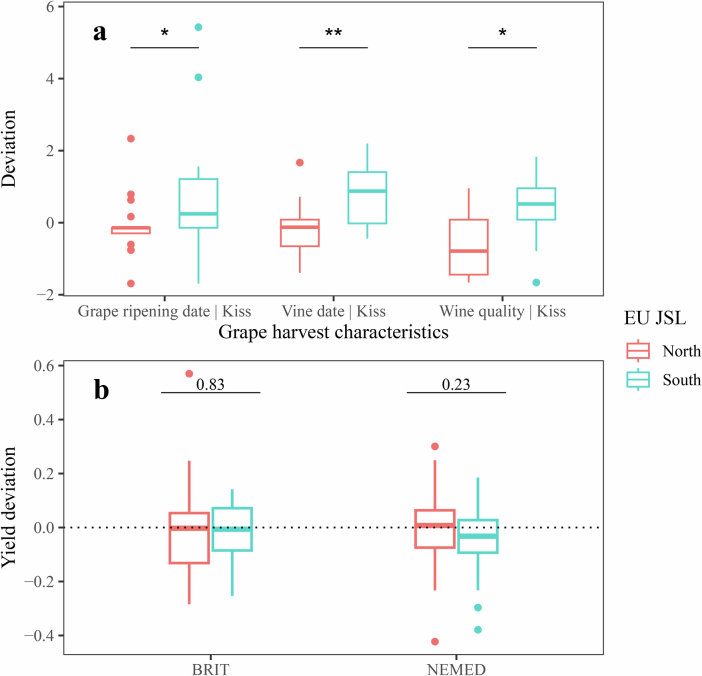
Extended Data Fig. 6. Influence of summer EU JSL extremes on historical grape phenology and instrumental grape yield.
(a) Boxplots showing the distribution of NEMED grape phenology (grape ripening date, vine date, and wine quality) data during historical northern (red) versus southern (blue) summer EU JSL extremes in NEMED region (data for BRIT not available). We determined EU JSL extremes by calculating D90 and D10 values over the period of overlap between grape phenology records and the EU JSL reconstruction. Wine quality deviation values were inversed for visualization purposes. Details of the grape phenology series, such as locations, references, period, and proxies can be found in Extended Data Table 5. (b) Boxplots showing the distribution of instrumental grape yield (1961–2018 ce) during northern (red) versus southern (blue) summer EU JSL extremes in BRIT and NEMED. We determined EU JSL extremes by calculating D80 (north, n = 12 years) and D20 (south, n = 12 years) values over the instrumental period 1961–2018 ce. Grape yield data are derived from the Food and Agricultural Organization (FAO) and were detrended using a 20-year smoothing spline (see Methods). In panels (a) and (b), we calculated statistical significance in grape phenology and yield distribution using a Wilcoxon signed-rank test. Significant results are represented by one (p ≤ 0.05) and two (p ≤ 0.01) asterisks in panel (a) and by p-values in panel (b). The lower and upper extremes are indicated by whiskers, and dots on each boxplot represent outliers.

