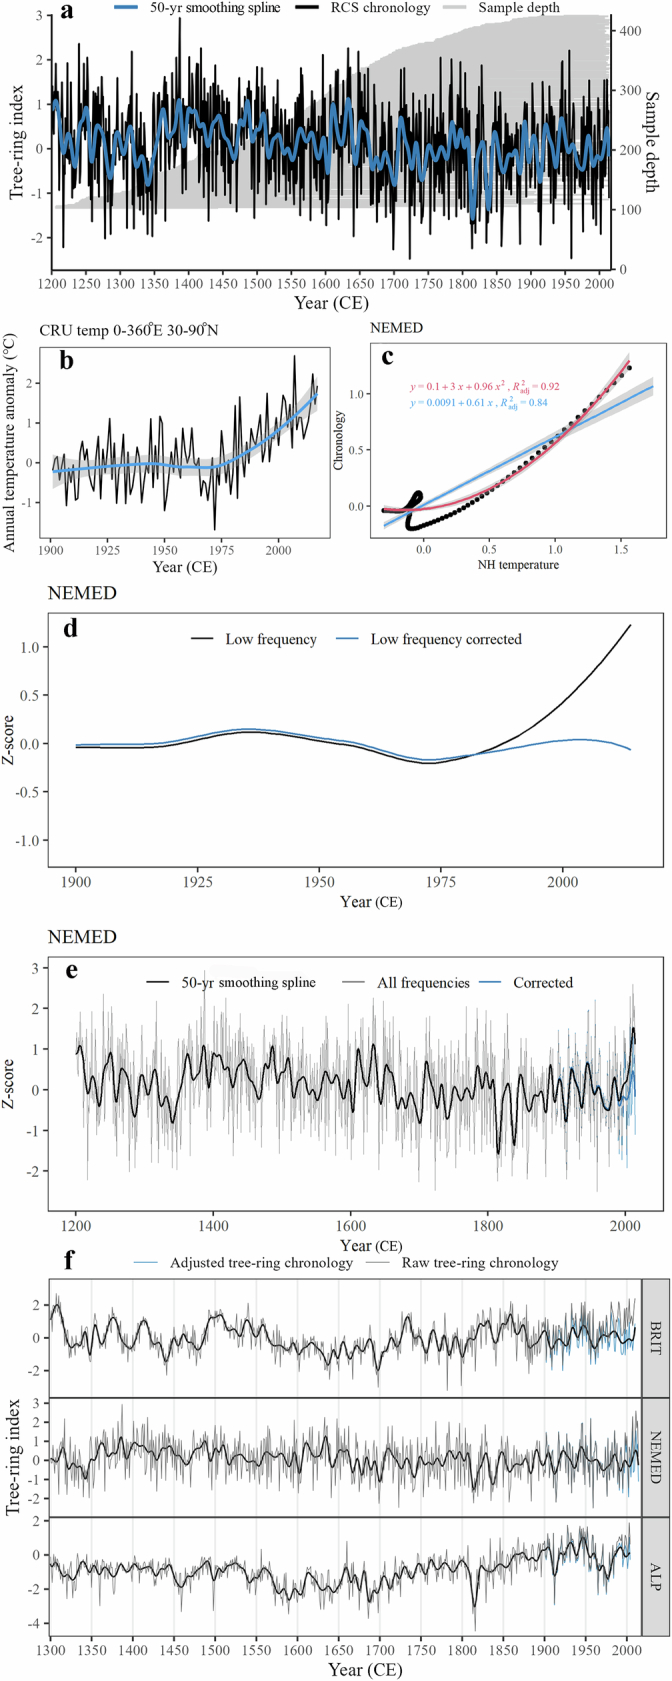
Extended Data Fig. 7. NEMED chronology, chronology adjustment, and comparison of raw and adjusted chronologies.

(a) The NEMED tree-ring maximum latewood density (MXD) chronology and sample depth (horizonal gray lines). The tree-ring chronology was truncated to the year with an expressed population signal (EPS) value above 0.85. The regional curve standardized (RCS) chronology is shown in black, and the low-pass filter (50-year smoothing spline) version of the chronology is shown in blue. Panels (b)-(e) show the scheme of chronology adjustment performed to remove the thermodynamic trend from the tree-ring chronology. The example shown here is for the NEMED chronology. Panel (b) shows interannual (black) and low-frequency (blue) variability of extra-tropical annual Northern Hemisphere (NH) temperature anomalies averaged over 0-360°E and 0-90°N (CRU ts4.05 dataset68) and then calculated using a 100-year loess smooth filter. Panel (c) shows the regression lines between the NH low-frequency temperature anomalies and the NEMED tree-ring chronology. Dots represent the raw data; the blue and red curves represent linear and non-linear regressions, respectively. Panel (d) shows the difference in low frequency variability of the original NEMED tree-ring chronology before (black) and after (blue) removing the thermodynamic effect caused by greenhouse gas forcing. In panel (e), low-frequency variability was highlighted by using a 50-year low-pass filter smoothing spline. Panel (f) shows the comparison between raw BRIT, NEMED, and ALP tree-ring chronologies (gray) and the same tree-ring chronologies adjusted after removing the thermodynamic trend (blue). Low-frequency variability of the adjusted chronology is shown in black and was calculated by low-pass filtering the original series using a 50-year smoothing spline. Further information on each chronology can be found in Extended Data Table 2.
