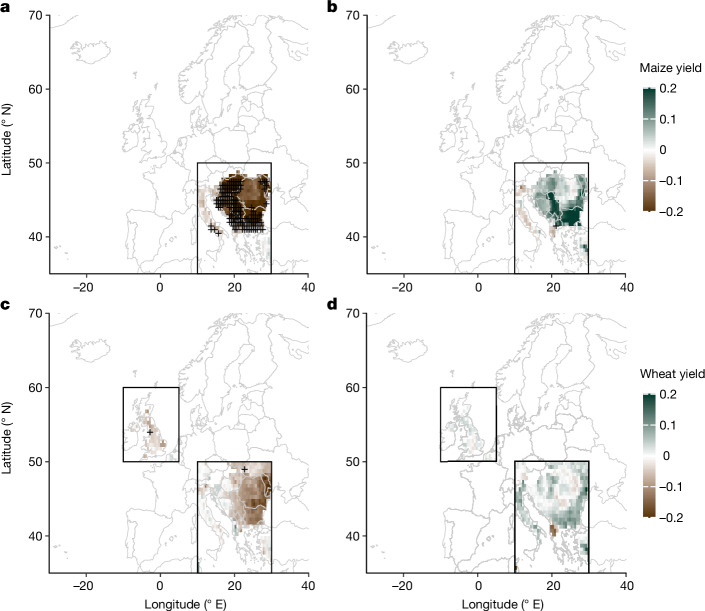
Fig. 2. Influence of EU JSL extremes on crop yield (1981–2016 ce).
a–d, Composite analysis maps of gridded maize (a,b) and wheat (c,d) yield for extremely northern (a,c; D80, n = 8 years) and southern (b,d; D20, n = 8 years) EU JSL positions over the period 1981–2016 ce. Maize yield composites were calculated for the NEMED region (no substantial maize data are available for the BRIT region) and wheat yield composites were calculated for the BRIT and NEMED regions. Coloured composite maps are shown only where P ≤ 0.1 and areas with statistically significant results after controlling for the false discovery rate (αFDR ≤ 0.1) are cross-hatched. Black boxes show the locations of BRIT and NEMED regions. Crop yield data were derived from the Global Dataset of Historical Yield gridded dataset and were detrended using a 20-year smoothing spline (Methods).

