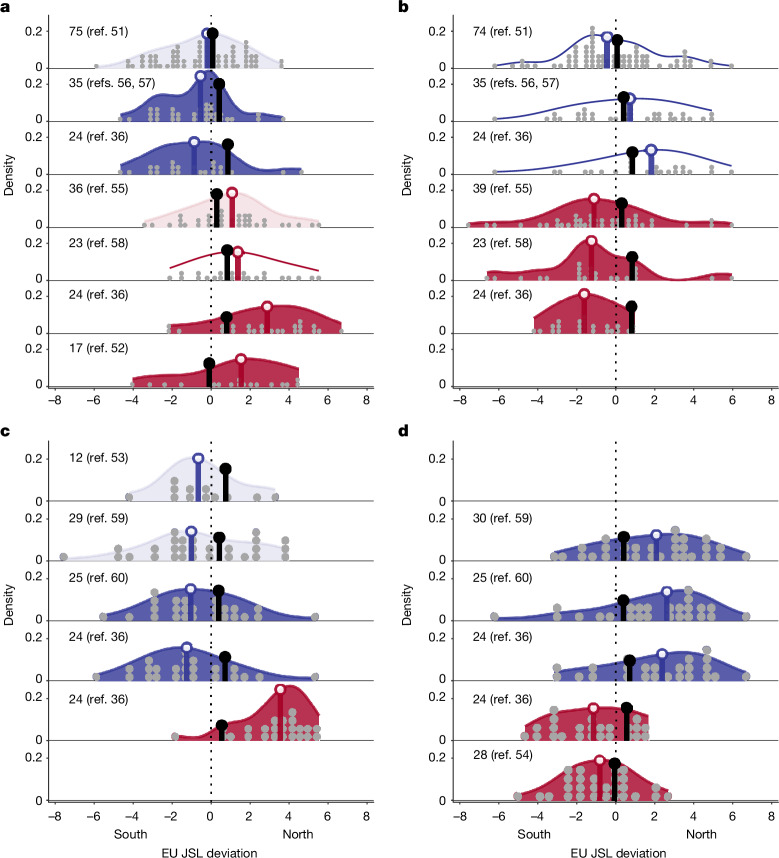
Fig. 4. Reconstructed summer EU JSL anomalies during historical climate extreme events.
a,b, Density plots of summer EU JSL deviations for historical July–August extreme hot (D90; a) and cold (D10; b) events relative to the mean summer EU JSL climatology (that is, non-extreme years; zero value shown by vertical dotted lines). c,d, The same for extreme dry (D10; c) and wet (D90; d) events (including floods). Results for NEMED are shown in red and results for BRIT are shown in blue. Statistically significant deviations, calculated using a Wilcoxon signed-rank test, are filled (P ≤ 0.05) or translucent (P ≤ 0.1). Vertical matchstick lines on the density plots represent the median values for reconstructed summer EU JSL during extreme (coloured) and non-extreme (black) years. A coloured matchstick line at the left of the black matchstick line indicates a summer EU JSL position further south and at the right of the black matchstick line indicates a summer EU JSL position further north compared with the EU JSL mean climatology. The grey dots indicate the distribution of EU JSL during the historical climate extreme years. The density curve was estimated by an empirical cumulative distribution function. The number of climatic extremes is shown in the figure and also listed in Extended Data Table 5 (refs. 36,51–60).

