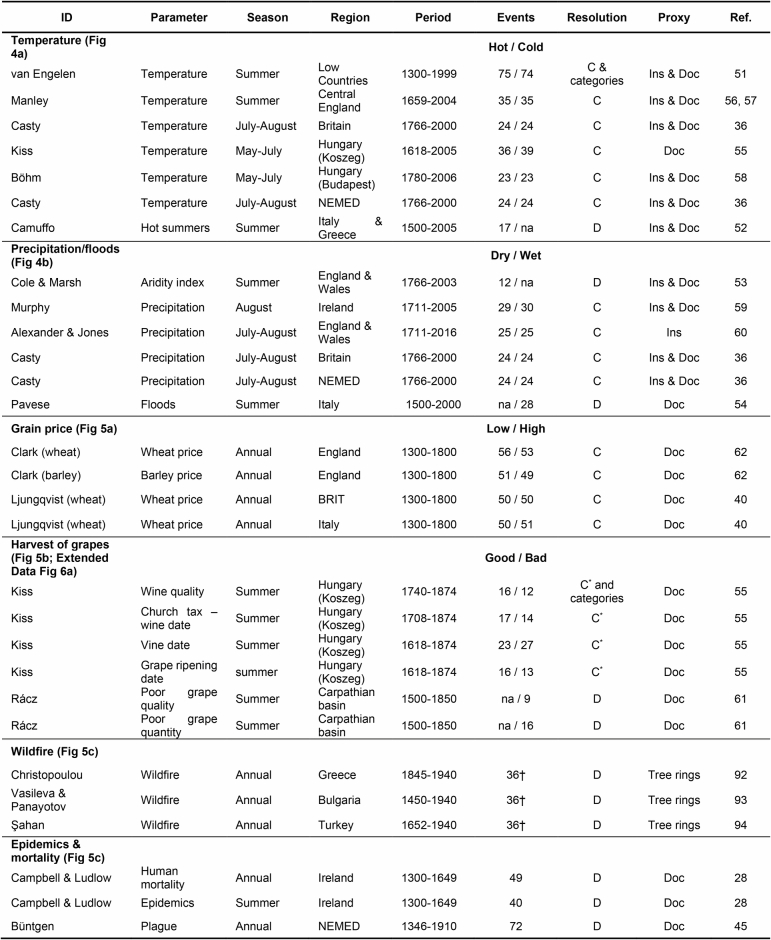
Extended Data Table 5.
Information on the temperature, precipitation, flood, crop price, grape phenology, wildfire, epidemics, and human mortality data used for the group comparison analyses for BRIT (blue) and NEMED (red) (Figs. 4, 5, and Extended Data Fig. 6)
The “events” column gives the total number of events in each record and “na” represents not available data; in the “resolution” column, “C” indicates a continuous dataset, C* indicates a continuous dataset with some missing values, whereas “D” indicates a discrete dataset (i.e., a list of discrete event years) and “categories” indicates that the data are classified by their degree of extreme; and in the “proxy” column, “Ins” indicates an instrumental dataset, whereas “Doc” indicates a documentary dataset (i.e., a historical record from documentary data). †36 is the total number of events in all included wildfire studies, which were combined into a single list of events for the analysis. Data from refs. 28,36,40,45,51–62,92–94.

