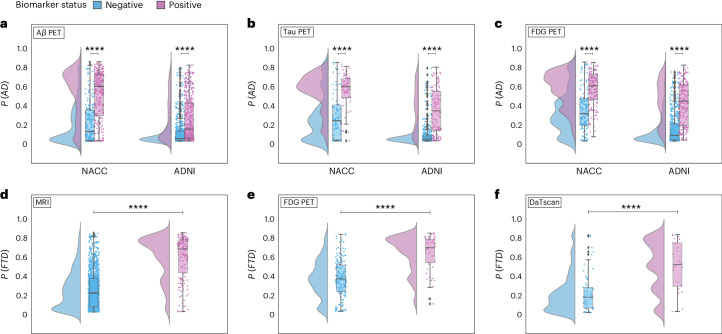
Fig. 4. Biomarker-level validation.
Raincloud plots representing model probabilities for dementia etiologies across their respective biomarker-negative (blue) and positive groups (pink). a, Model-predicted probabilities for AD, P(AD), were analyzed in relation to amyloid β (Aβ) positivity status using a one-sided Mann-Whitney U test for the NACC cohort (n = 440, U = 10,303.50, P = 2.04 × 10⁻²⁵) and a one-sided t-test for ADNI (n = 1,108, t = −12.06, P = 9.74 × 10⁻³¹). b, Differences in P(AD) between tau PET negative and positive biomarker groups were analyzed using the one-sided Mann-Whitney U tests for NACC (n = 132, U = 935.50, P = 6.48 × 10⁻⁸) and ADNI (n = 475, U = 5,857.50, P = 4.10 × 10⁻²⁷). c, Similar analyses were run to differentiate P(AD) between fluorodeoxyglucose (FDG) PET biomarker groups in NACC (n = 261, U = 3,730.00, P = 3.00 × 10⁻¹⁵), and ADNI (n = 760, U = 14,924.00, P = 5.66 × 10−43). d, e, In the NACC cohort, model-predicted probabilities for frontotemporal lobar degeneration, P(FTD), were assessed across MRI (n = 1,494, 30,935.50, P = 1.52 × 10−51) and FDG PET biomarker groups (n = 233, U = 1,599.50, P = 2.08 × 10⁻¹³) using a one-sided Mann-Whitney U test. f, In NACC, LBD probabilities, P(LBD), were analyzed between DaTscan negative and positive groups using a one-sided Mann-Whitney U test (n = 91, U = 318.50, P = 6.26 × 10⁻⁶). All boxplots presented include a box presenting the median value and IQR, with whiskers extending from the box to the maxima and minima no further than a distance of 1.5 times the IQR. In all plots, ****P < 0.0001, and results were not corrected for multiple comparisons.

