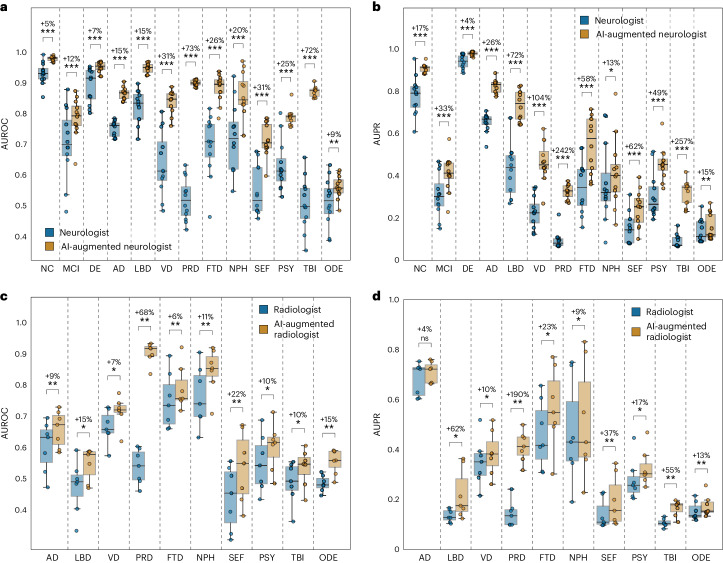
Fig. 5. AI-augmented clinician assessments.
Comparison between the performance of the assessments provided by practicing clinicians versus model-assisted clinicians is shown. a,b, For the analysis, neurologists (n = 12) were given 100 randomly selected cases encompassing individual-level demographics, health history, neurological tests, physical as well as neurological examinations, and multisequence MRI scans. The neurologists were then tasked with assigning confidence scores for NC, MCI, dementia and the 10 dementia etiologies: AD, LBD, VD, PRD, FTD, NPH, SEF, PSY, TBI and ODE (Glossary 1). The boxplots show AUROC in a and AUPR in b for individual neurologist and model-assisted neurologist performance (defined as the mean between model and neurologist confidence scores). Pairwise statistical comparisons were conducted using the one-tailed Wilcoxon signed-rank test without corrections made for multiple comparisons, with significance levels denoted as: ns (not significant) for P ≥ 0.05; *P < 0.05, **P < 0.01, ***P < 0.001 ****P < 0.0001. Detailed statistics and P values can be found in Table S14. The percent increase in mean performance for each etiology is also presented above each statistical annotation. c,d, Similarly, in a separate analysis, radiologists (n = 7) were given 70 randomly selected cases with a confirmed dementia diagnosis encompassing individual-level demographics and multisequence MRI scans. The radiologists were tasked with assigning confidence scores for the 10 dementia etiologies, and the boxplots show AUROC in c and AUPR in d for the individual radiologist and model-assisted radiologist performance for the 10 etiologies. Statistical annotations and percent increase in mean performance with respect to each etiology are shown in a similar fashion, with significance levels corresponding to the results of unadjusted one-tailed Wilcoxon signed-rank tests denoted as *, **, *** and ****. Detailed statistics and P values can be found in Table S15. Each boxplot includes a box presenting the median value and IQR, with whiskers extending from the box to the maxima and minima no further than a distance of 1.5 times the IQR.

