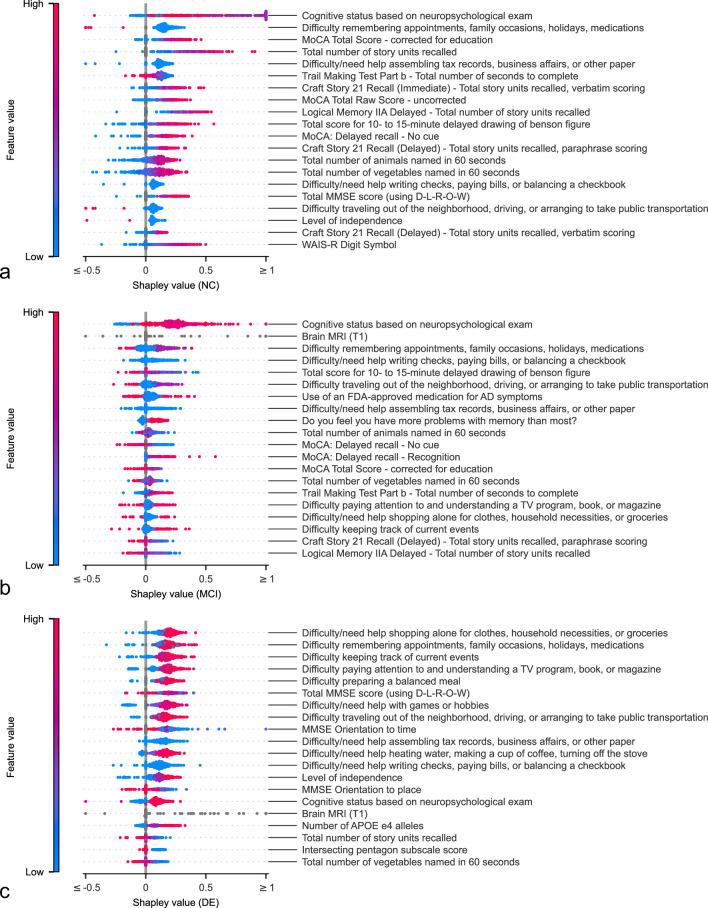
Extended Data Fig. 1. Shapley analysis on cases from the NACC test set comprising individuals along the cognitive spectrum.
The figure presents the top twenty contributing features for the model’s positive predictions of a, NC, b, MCI, and c, DE labels, ranked by their mean Shapley values. These values, representing the average contribution of each feature to the model’s decision, guide the ranking from the highest to the lowest impact. For each diagnostic group, a subset of n = 500 cases with the most available features were selected for analysis.

