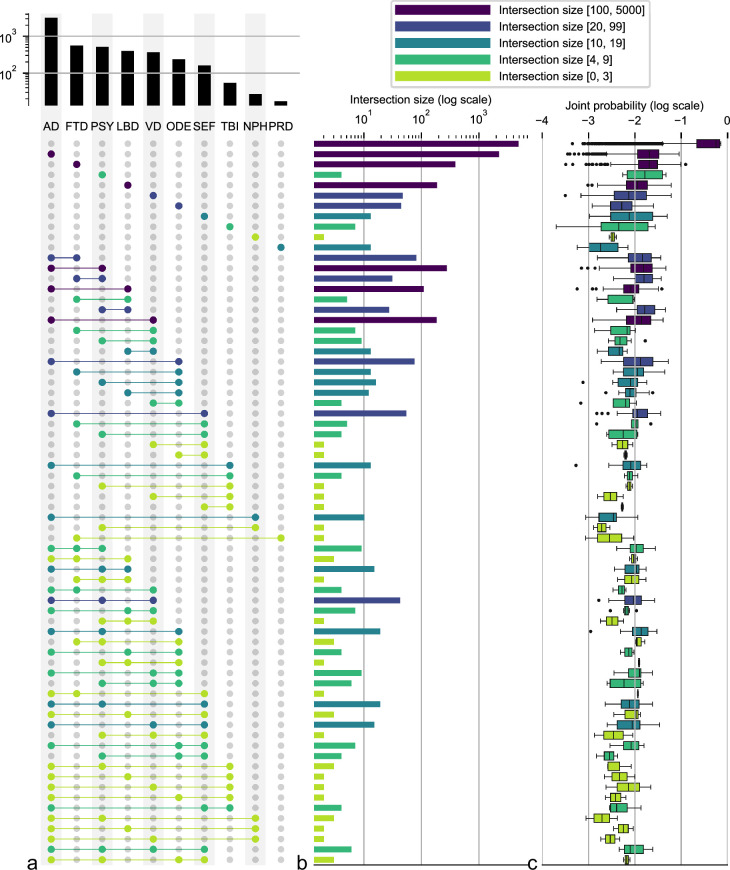
Extended Data Fig. 2. UpSet plot depicting the distribution and model-predicted probabilities of the etiological categories in NACC testing.
a, Single and co-occurring diagnostic categories are enumerated, offering a tally of each condition’s frequency within the dataset. b, A logarithmic scale is used to delineate the overlap among these categories, shedding light on their relative commonality and the extent of their coexistence. This method grants a refined perspective on the prevalence of comorbid conditions. c, Boxplots delineating the spread and central tendency of the model’s predicted probabilities for each combination of diagnostic categories. The legend in the upper right interprets the sizes within b and c, providing a reference for the logarithmic data representation. All boxplots include a box presenting the median value and interquartile range (IQR), with whiskers extending from the box to the maxima and minima no further than a distance of 1.5 times the IQR.

