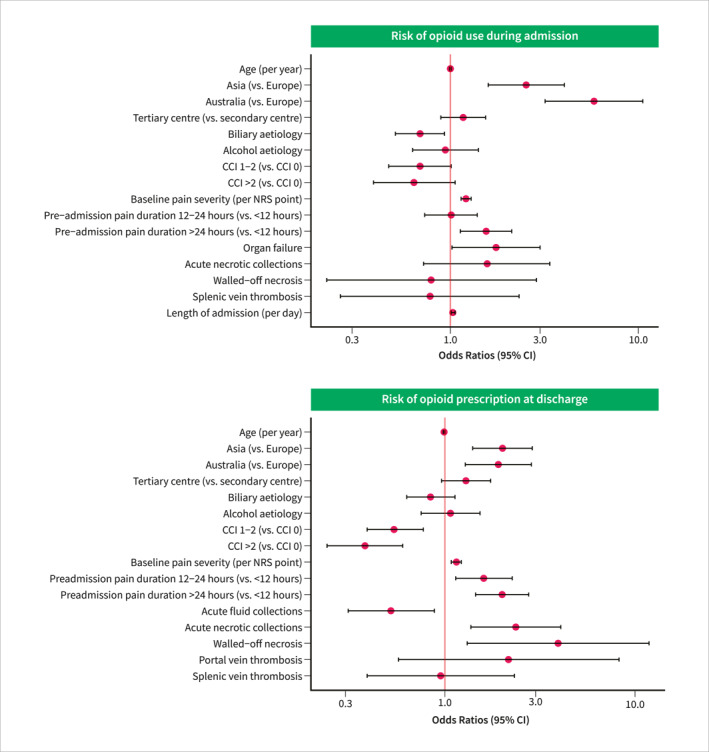
FIGURE 4.

Forest plot illustrating the odds ratios for opioid use during admission or at discharge (multivariable analysis). CCI, Charlson comorbidity index; CI, confidence interval; NRS, numeric rating scale.

Forest plot illustrating the odds ratios for opioid use during admission or at discharge (multivariable analysis). CCI, Charlson comorbidity index; CI, confidence interval; NRS, numeric rating scale.