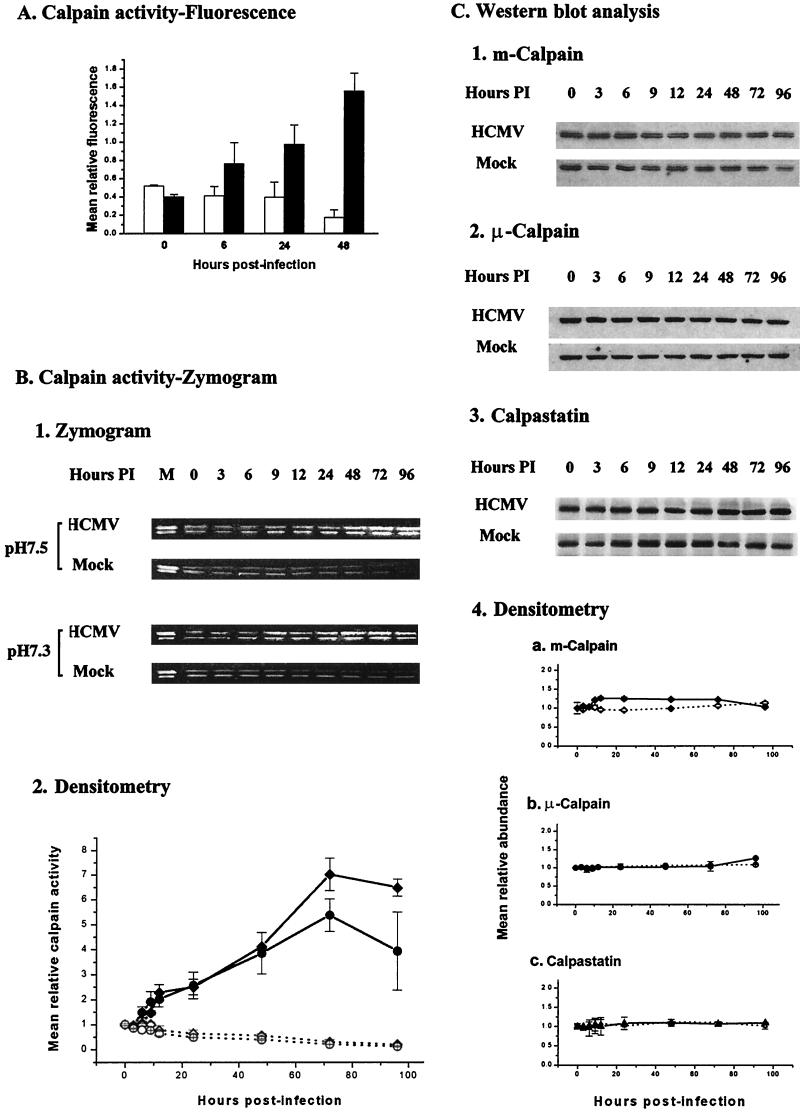
FIG. 7.
(A) The time course for calpain activity in HCMV (5 PFU/cell)-infected (solid bars) and mock-infected (open bars) density-arrested cells. Calpain activity was measured by exposing the cells to the cell-permeant fluorogenic calpain substrate Boc-Leu-Met-CMAC (18 μM) for 15 min before the fluorescence intensity was measured for equal numbers of HCMV- and mock-infected cells, using an SLM 4800S spectrofluorometer. Excitation was at 380 nm; emission was at 460 nm. The polarizers were set at 0° and 50°. The data plotted are the means (± standard deviation) of the findings from three independent experiments. (B) 1, representative casein zymogram. Density-arrested LU cells were either infected with HCMV (5 PFU/cell) or mock infected. The cells were harvested at the times indicated and processed for zymography as described in Materials and Methods. Since calpain activity is pH dependent, the gels were incubated in incubation buffer at either pH 7.5 (optimal for μ-calpain) or pH 7.3 (optimal for m-calpain). Purified μ- and m-calpain (0.1 U of each) were added to the sample in lane 1 as a positive control. The upper band in each lane corresponds to μ-calpain, whereas the lower band corresponds to m-calpain (89). 2, data for calpain activity based on the means (± standard deviation) of the intensity of bands at each time relative to the intensity of the corresponding band at 0 h p.i. for the zymograms shown above (⧫, μ-calpain, HCMV-infected cells; ◊, μ-calpain, mock-infected cells; ●, m-calpain, HCMV-infected cells; ○, m-calpain, mock-infected cells). (C) 1 to 3, abundances of m-calpain, μ-calpain, and calpastatin in parallel cell cultures as determined by Western blot analysis (results of a representative experiment); 4, densitometric analysis of the results shown in panel A and two additional experiments with standard deviation. Solid symbols (⧫, m-calpain; ●, μ-calpain, ▴, calpastatin) and line represent the means of the results for HCMV-infected cells; open symbols (◊, m-calpain; ○, μ-calpain; ▵, calpastatin) and dashed line represent the results for mock-infected cells. Error bars not shown are smaller than the symbol.

