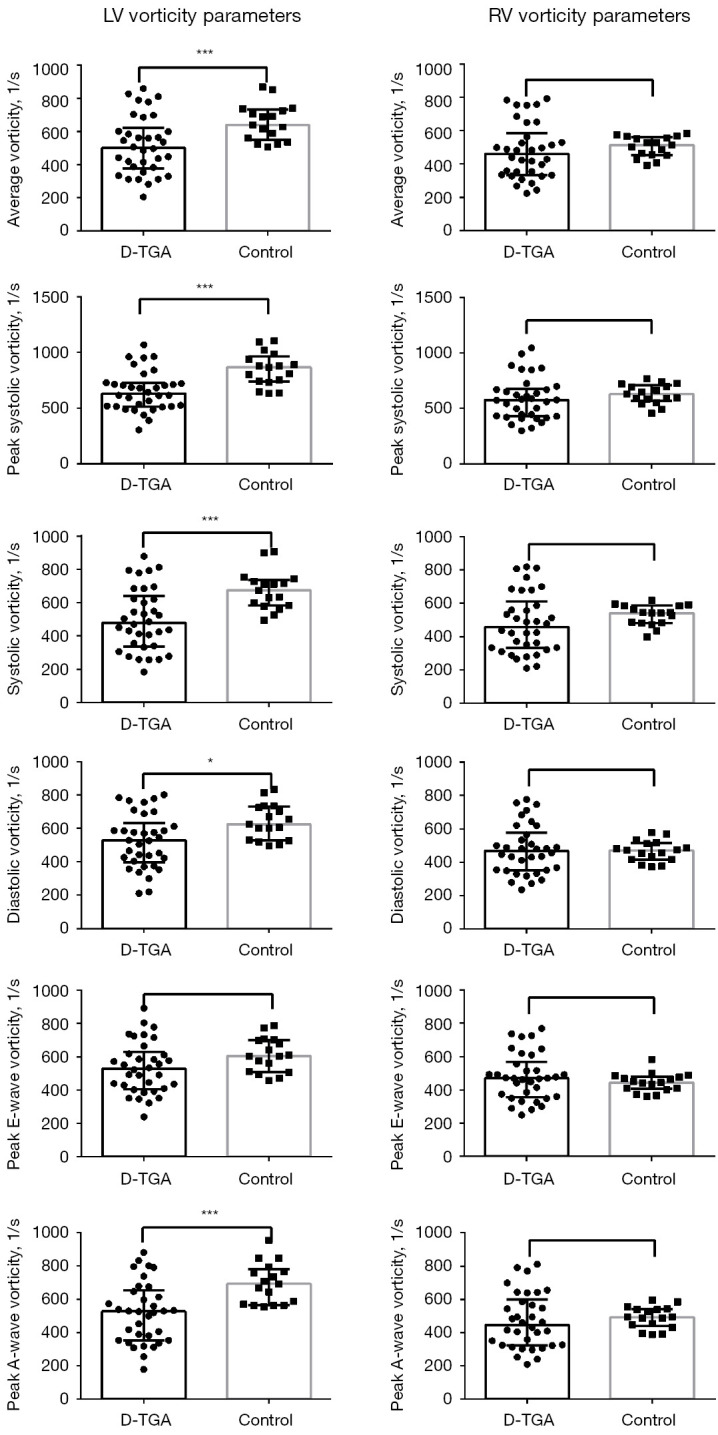
Figure 6.

Comparison of the vorticity of both ventricles between the D-TGA group and the control group. *, P<0.05 compared with healthy controls; ***, P<0.001 compared with healthy controls. LV, left ventricle; RV, right ventricle; D-TGA, dextro-transposition of the great arteries.
