
FIGURE 2.
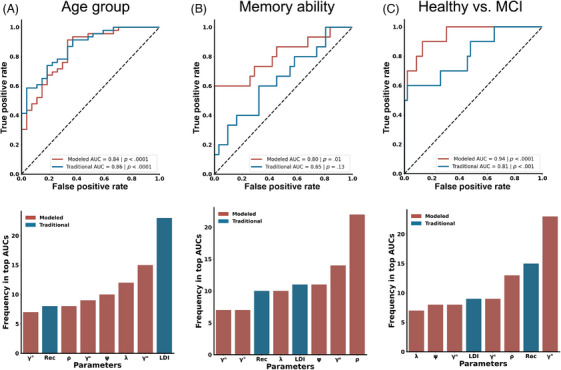
Comparison of traditional (blue) to MPT model (red) performance in questions 1 to 3. ROC curves (top) demonstrating predictive value of traditional and model‐based measures and frequency of presence in top 30 AUCs in 8‐choose‐4 combinatorial analyses (bottom) are shown. (A) Comparison of age group predictions showing no significant difference between traditional measures and MPT model‐based measures. LDI emerges as the most frequent metric in the top third of AUCs. (B) Metrics derived from MPT model better predict the performance of high‐ versus low‐performing older adults. The gist‐based recognition memory signal metric (ρ) is the predominant metric in the 8‐choose‐4 analysis for predictive accuracy. (C) MPT model‐based metrics were superior at identifying healthy versus MCI. Within the 8‐choose‐4 analysis, γO is the leading metric for MCI prediction. AUC, area under a curve; LDI, lure discrimination index; MCI, mild cognitive impairment; MPT, multinomial processing tree; MST, Mnemonic Similarity Task.