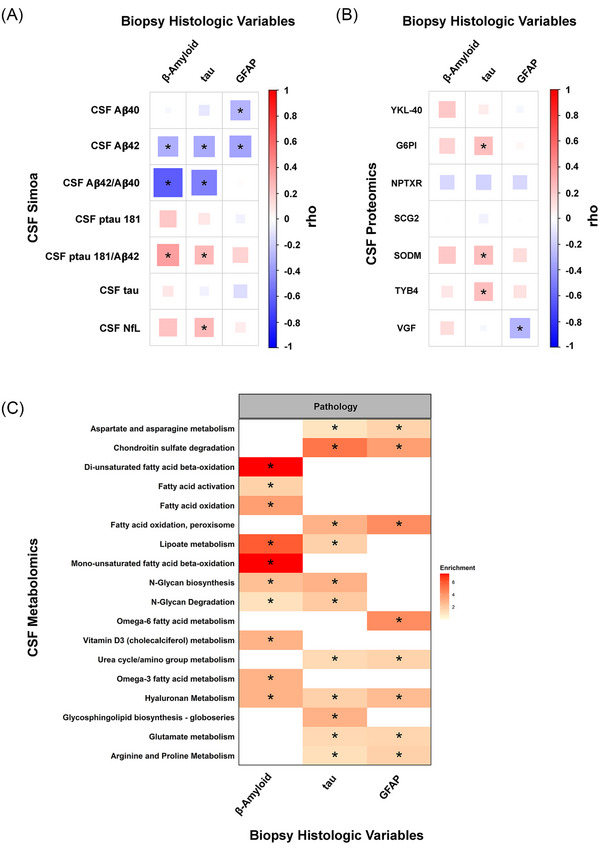
FIGURE 2.

Histologic measurements of AD pathology correlate with CSF biomarkers. (A) Correlations of histologic data with CSF Simoa measurements of AD biomarkers. All correlations shown in this figure are Spearman's rank correlation coefficient. The n for each Simoa analysis is variable due to some sample failure. In summary, 80 samples have CSF Aβ40 values, 78 samples have CSF Aβ42 values, 78 samples have CSF Aβ42/40 values, 80 have CSF ptau 181 values, 77 have CSF ptau 181/Aβ42 values, 80 have CSF tau values, and all 81 have CSF NfL values. GFAP staining was also only achieved on 80 samples. All other analyses here and in the rest of the study are completed on all 81 samples. (B) Spearman's correlations of the seven core proteins highlighted in this study with quantified β‐amyloid, tau, and GFAP on biopsy. (C) Biological pathways highlighted by mummichog analysis of metabolite correlations with histologic variables (see the Methods section); *FDR adjusted p‐value < 0.05 in panels A and C, *p‐value < 0.05 in panel B. See text for details, and Tables S2, S6, and S7 for numbers used in this figure. AD, Alzheimer's disease; CFS, Cerebrospinal fluid.
