
FIGURE 3.
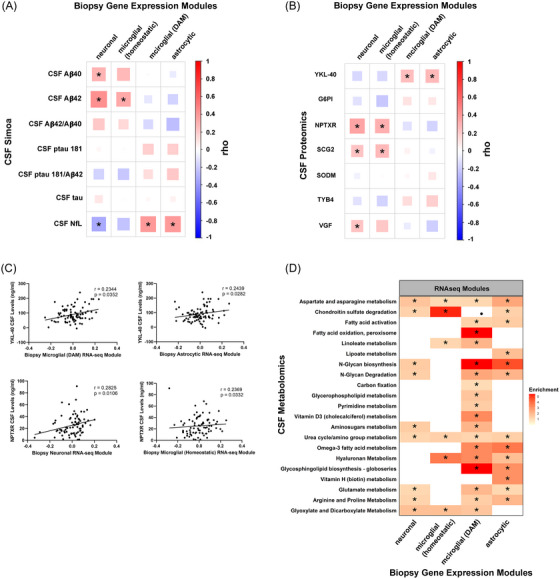
Biopsy gene expression modules correlate with CSF biomarkers. (A) Correlations of gene expression modules from Figure 1B with CSF Simoa measurements of AD biomarkers. All correlations shown in this figure are Spearman's rank correlation coefficient. (B) Spearman's correlations of the seven core proteins highlighted in this study with gene expression modules. (C) Spearman's correlation across 81 CSF samples of YKL‐40 ELISA values versus microglial (DAM) and astrocytic module eigengenes and NPTXR ELISA values versus neuronal and microglial homeostatic module eigengenes. r‐ and p‐values indicated. (D) Biological pathways highlighted by mummichog analysis of metabolite correlations with gene expression modules (see the Methods section); *FDR adjusted p‐value < 0.05 in panels A and D , *p‐value < 0.05 in panel B. See text for details, and Tables S2, S6, S7, and S9 for numbers used in this figure. AD, Alzheimer's disease; CFS, Cerebrospinal fluid; DAM, disease‐associated microglia.