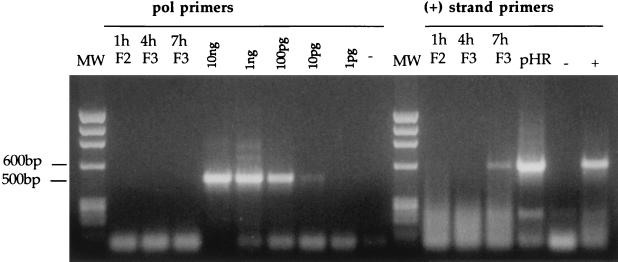
FIG. 4.
PCR analyses of equilibrium density fractions containing cytoplasmic extracts collected 1, 4, and 7 h postinfection. Selected fractions from the equilibrium density gradients shown in Fig. 1 were subjected to PCR using primers specific for the Gag-Pol region (pol primers; expected band size is 500 bp) and for the positive (+)-strand DNA (expected size is 600 bp). Fractions 2 and 3 (F2 and F3) are the same as in Fig. 1. Serial dilutions of pCMVΔR9 plasmid DNA were used as the internal standard for Pol PCR. Hirt DNA from uninfected cells was used as negative control (−). Plasmid pHR' and Hirt DNA from infected cells were used as internal controls for the (+)-strand PCR. MW, DNA molecular weight standards. Low-molecular-weight bands are PCR artifacts.

