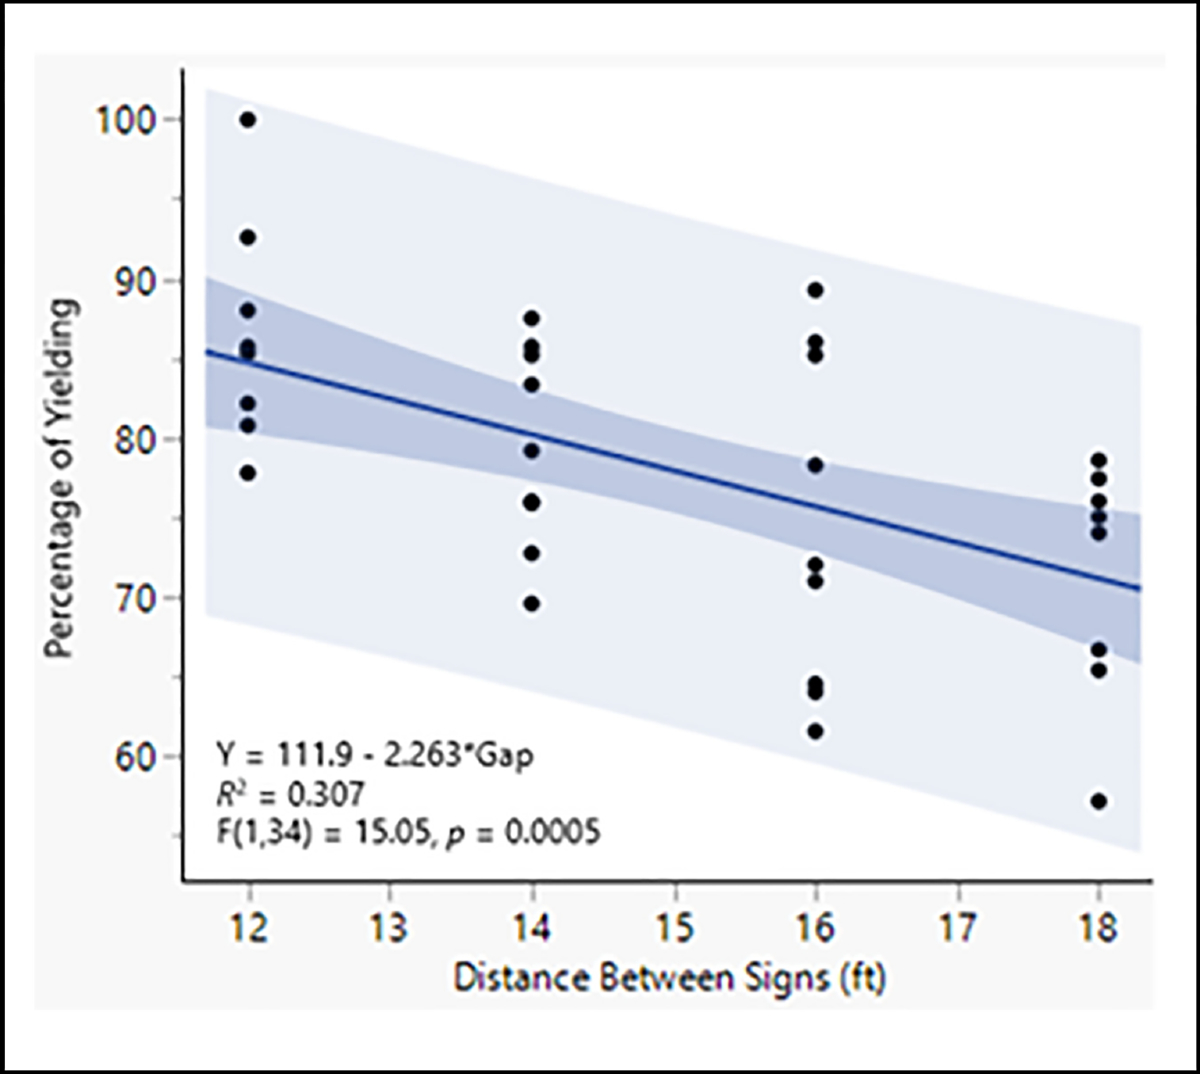
Figure 5.

Linear regression of yielding by distance between signs. The dark blue line represents the linear relationship between yielding and distance between the signs. The blue shaded region depicts the confidence band and the light blue the prediction band. The distance between signs accounted for approximately 31% of the difference in yielding.
