
Figure 9.
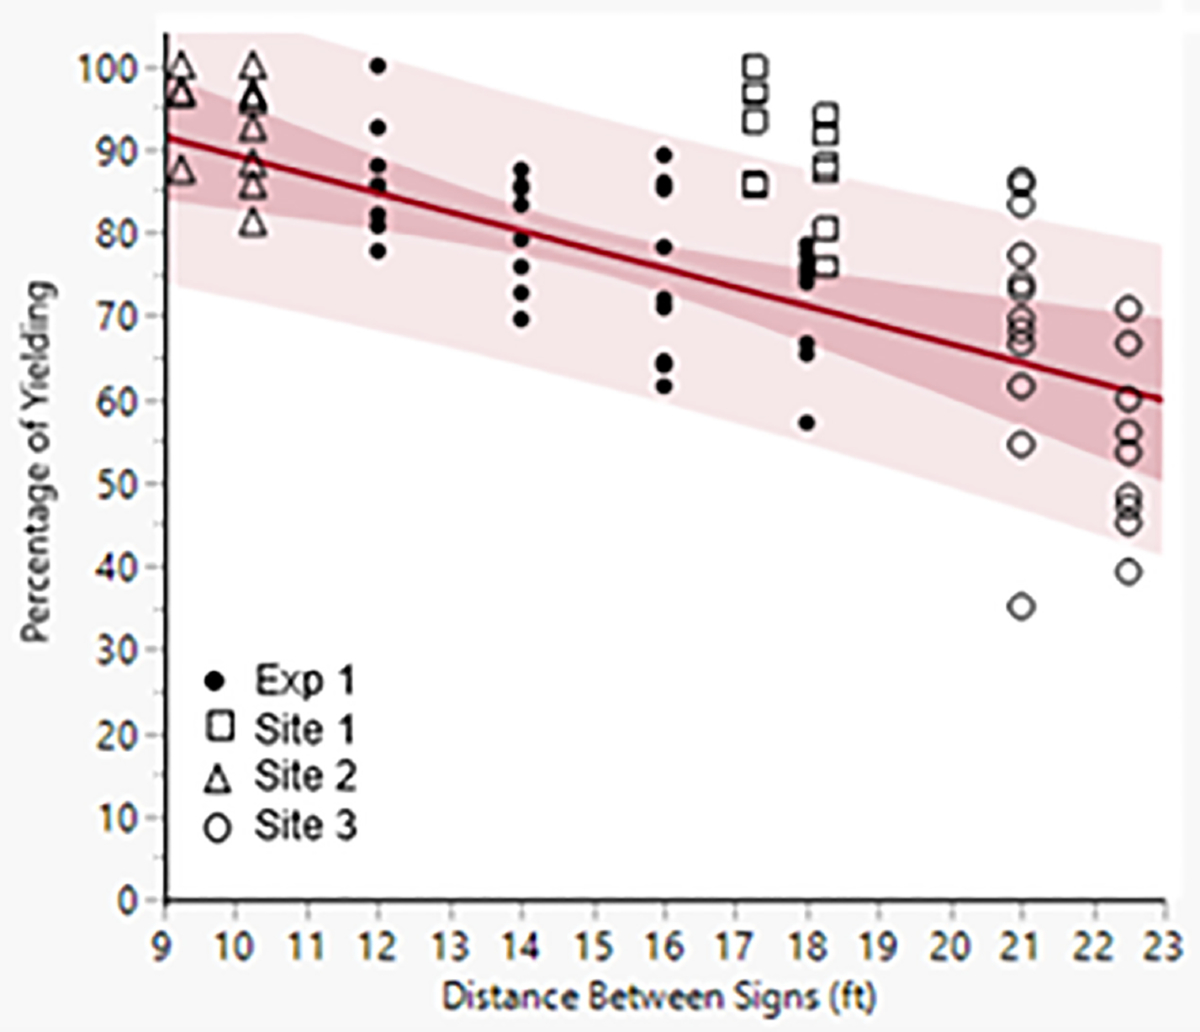
Yielding by distance between signs in Experiment 2 combined with yielding data from Experiment 1. Yielding scores for Sites 2 and 3 appear consistent with the linear relationship identified in Experiment 1. Yielding at Site 1 was higher than expected based on the distance between signs.