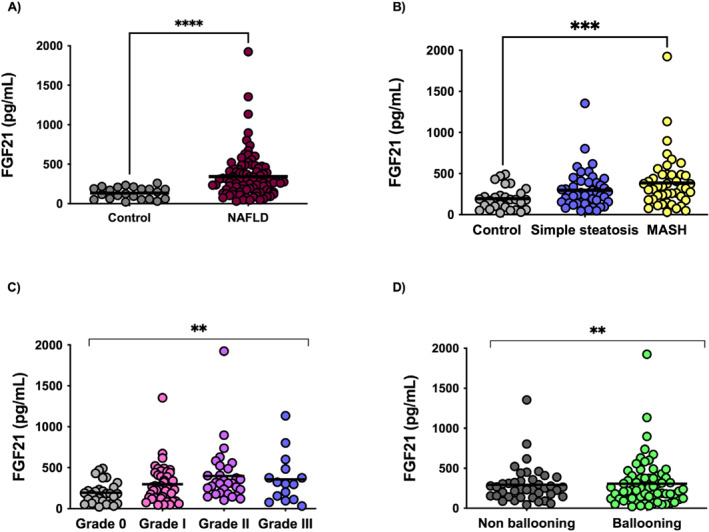
FIGURE 5.

Serum FGF21 levels are raised in (a) MASLD patients (n = 89) versus healthy controls (n = 28); (b) MASH (n = 44) versus MASLD (n = 44) versus healthy controls (n = 28); (c) according to steatosis degree, 0%–5% steatosis (n = 28), 6%–33% steatosis (n = 44), 34%–66% steatosis(n = 30) and 66% steatosis (n = 15); (d) according to hepatocyte ballooning. ***p < 0.001; **p < 0.01; *p < 0.05. Mann‐Whitney and Kruskal‐Wallis tests corrected for the Bonferroni test have been used for these comparisons.
